
Continuous Bioprocessing MarketSize, Share & Industry Analysis, 2026-2034By ProductBy Process StageBy ApplicationBy End UserBy Operation ModeBy Technology PlatformBy Scale of OperationBy Expression SystemBy Chromatography ModeBy Ownership Model
Full title & scope — all 10 axes with their segments
Continuous Bioprocessing Market Size, Share & Industry Analysis, By Product (Chromatography Systems & Consumables, Filtration Systems & Devices, Bioreactors, Cell Culture Media, Buffers & Reagents, Process Analytics & Control Systems, Cell Retention Devices), By Process Stage (Upstream, Downstream, Integrated End-to-End), By Application (Monoclonal Antibodies, Vaccines, Cell & Gene Therapy, Recombinant Proteins, Biosimilars, Other Applications), By End User (Pharmaceutical & Biotechnology Companies, Contract Development & Manufacturing Organizations, Contract Research Organizations, Academic & Research Institutes), By Operation Mode (Fully Continuous, Hybrid, Perfusion with Intensified Fed-Batch), By Technology Platform (Single-Use, Stainless Steel, Hybrid Single-Use/Stainless), By Scale of Operation (Research & Process Development Scale, Pilot Scale, Commercial Scale), By Expression System (Mammalian Cells, Microbial, Insect Cells, Cell-Free Systems), By Chromatography Mode (Multicolumn Countercurrent Solvent Gradient, Periodic Countercurrent Chromatography, Simulated Moving Bed, Continuous Annular Chromatography, Other Continuous Modes), By Ownership Model (In-House Manufacturing, Outsourced Manufacturing), and Regional Forecast, 2026-2034
Market outlook, key takeaways, drivers and challenges for the report period.
- 01By ProductChromatography Systems & Consumables · Filtration Systems & Devices · Bioreactors
- 02By Process StageUpstream · Downstream · Integrated End-to-End
- 03By ApplicationMonoclonal Antibodies · Vaccines · Cell & Gene Therapy
- 04By End UserPharmaceutical & Biotechnology Companies · Contract Development & Manufacturing Organizations · Contract Research Organizations
- 05By Operation ModeFully Continuous · Hybrid · Perfusion with Intensified Fed-Batch
- 06By Technology PlatformSingle-Use · Stainless Steel · Hybrid Single-Use/Stainless
- 07By Scale of OperationResearch & Process Development Scale · Pilot Scale · Commercial Scale
- 08By Expression SystemMammalian Cells · Microbial · Insect Cells
- 09By Chromatography ModeMulticolumn Countercurrent Solvent Gradient · Periodic Countercurrent Chromatography · Simulated Moving Bed
- 10By Ownership ModelIn-House Manufacturing · Outsourced Manufacturing
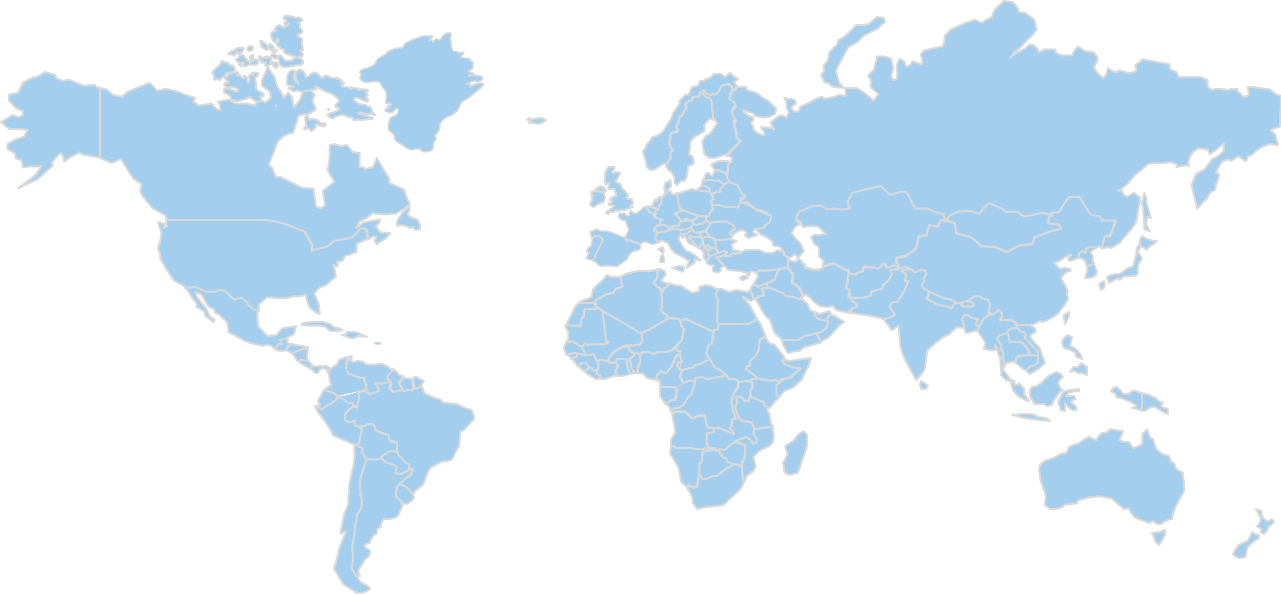
- 11By Region
Market Analysis & Outlook
Continuous bioprocessing replaces batch-by-batch production of biologic drugs with a steady flow of material through linked unit operations: perfusion bioreactors, continuous capture and polishing chromatography, filtration, and in-line analytics and control. The market covers the equipment, single-use assemblies, media, buffers and reagents that run these trains, in fully continuous and intensified hybrid forms. Buyers are biopharmaceutical developers and manufacturers, contract development and manufacturing organisations, and research institutes developing new processes.
The global continuous bioprocessing market is valued at USD 360 million in 2025 and is set to reach USD 1220 million by 2034, a compound annual growth rate of 14.33% across the 2026-2034 forecast period. The study tracks the market across USD 170 million in 2020, USD 310 million in 2024, USD 418 million in 2026 and USD 740 million in 2030.
24% of 2025 revenue sits in Chromatography Systems & Consumables, worth USD 86.4 million and rising to USD 244 million at 20% by 2034, the largest product line in both years. Growth is fastest in Process Analytics & Control Systems at 19% and slowest in Chromatography Systems & Consumables at 12%. Share moves toward Process Analytics & Control Systems and Cell Retention Devices and away from Chromatography Systems & Consumables, Filtration Systems & Devices, Bioreactors, Cell Culture Media and Buffers & Reagents, though no line shrinks in revenue terms.
By process stage, Downstream accounts for 48% of 2025 revenue at USD 172.8 million, reaching USD 536.8 million and 44% by 2034. Integrated End-to-End grows faster at 21.2% against 13.4%, moving from 12% of revenue to 20% by 2034. This axis divides the same revenue as the product split instead of adding to it, so the two are read together and never summed.
North America is the largest region at 40.5% of 2025 revenue, worth USD 145.8 million and reaching USD 439.2 million by 2034. Europe follows at 28%, moving from USD 100.8 million to USD 322.08 million, and Latin America is the smallest at 4.3%. Share shifts toward Asia Pacific over the forecast period, so the regional split repays a close reading.
Behind these figures sit five regions, seven product lines and ten segmentation axes, each reported for every year from 2020 to 2034. The headline 2025 value is arrived at by triangulating published aggregates against category proxies, not by an independent count, and the same applies to the segment, regional and country breakdowns drawn from it.
Market Size, 2020–2034
USD MillionRevenue in USD Million. Values up to 2025 are actuals; 2026–2034 are forecast.
Key Takeaways
- The global continuous bioprocessing market moves from USD 170 million in 2020 to USD 360 million in 2025 and USD 1220 million by 2034, the forecast period compounding at 14.33% a year.
- The largest line by product is Chromatography Systems & Consumables, worth USD 86.4 million and 24% of revenue in 2025, rising to USD 244 million and 20% by 2034.
- At 19%, Process Analytics & Control Systems grows faster than any other product line, moving from USD 39.6 million and 11% of revenue in 2025 to USD 195.2 million and 16% in 2034.
- Against a base case of USD 1220 million in 2034, the study also reports a bear case at USD 940 million and a bull case at USD 1440 million, with the assumptions behind each set out separately.
- 40.5% of 2025 revenue is generated in North America, worth USD 145.8 million and rising to USD 439.2 million by 2034; Latin America is smallest at 4.3%.
- 87.79% of North America's base-year revenue comes from the United States alone: USD 128 million in 2025, rising to USD 380 million by 2034, which is why it is that region's worked example.
- Every line on all ten segmentation axes and in each of the five regions carries its own revenue, share and growth rate for all fifteen years, 2020 through 2034, on a 2025 base.
Market Trends
Revenue Share, By Product
Base year 2025Chromatography Systems & Consumables leads with 24.0% of product segment revenue.
Share of product segment revenue, most recent base year. The 1 smallest segments are grouped as Other.
Three things move over 2026-2034, and they are worth separating: the product mix, the regional balance, and the 14.33% compounding underneath both.
The direction of the market is not in question in any of the three. Each line and each region grows in revenue terms; what separates them is which takes the larger part of the growth.
The product mix tilts toward Process Analytics & Control Systems. Process Analytics & Control Systems grows at 19% across 2026-2034 against 12% for Chromatography Systems & Consumables, the widest spread on the product axis. Shares follow: 11% to 16% for Process Analytics & Control Systems, 24% to 20% for Chromatography Systems & Consumables. Revenue rises on both sides; USD 39.6 million to USD 195.2 million and USD 86.4 million to USD 244 million respectively, so this is a change in composition, not a contraction, and one forecast window is long enough for it to matter.
Growth concentrates in Asia Pacific. Asia Pacific moves from 22% of revenue in 2025 to 28.3% in 2034, worth USD 79.2 million rising to USD 345.26 million. Share moves off the others in turn: North America at 40.5% moving to 36%, Europe at 28% moving to 26.4%, Latin America at 4.3% moving to 4.3%, Middle East and Africa at 5.2% moving to 5%, each still growing in revenue terms. That makes the regional split worth reading directly instead of scaling from the global rate: the same market rate produces different outcomes depending on where a supplier's revenue sits.
Growth compounds at 14.33% without a step change. Reading the series: USD 170 million in 2020, USD 310 million in 2024, USD 360 million in 2025, USD 418 million in 2026, USD 740 million in 2030 and USD 1220 million in 2034. No year breaks the trajectory, and the 14.33% forecast rate compares with 16.19% recorded over 2020-2025, a continuation, not an inflection. The risk in the number sits in the mix assumptions, not in whether the market grows at all, which is where the product and regional sections come in.
Market Growth Factors
The fastest line decides the blended rate
Market Drivers
3- 01The fastest line decides the blended rate
Process Analytics & Control Systems compounds at 19% against 14.33% for the market, rising from USD 39.6 million in 2025 to USD 195.2 million in 2034 and from 11% of revenue to 16%. The market's overall 14.33% depends on that rate holding: at the 12% recorded by Chromatography Systems & Consumables, the same revenue base would compound to a materially smaller 2034 total. A portfolio weighted away from it tracks below the market even in a market growing everywhere.
- 02Growth lands where the revenue already is
40.5% of 2025 revenue (USD 145.8 million) is generated in North America, reaching USD 439.2 million by 2034 at an unchanged 36%. Behind it, Europe holds 28%; USD 100.8 million rising to USD 322.08 million. Together the two account for the majority of both the 2025 base and the revenue added by 2034, which is why a regional plan treating all five regions at equal weight misreads where the growth actually lands.
- 03Fifteen years of unbroken growth underpin the forecast
USD 170 million in 2020, USD 310 million in 2024 and USD 360 million in 2025: 16.19% compound growth before the forecast period even begins. The forecast period then runs at 14.33%, ending 2034 at USD 1220 million. Fifteen years of unbroken growth in the series means the forecast rests on a demonstrated trajectory, not a projected turnaround, and it is why the 14.33% rate is applied flat across the whole period instead of ramped through it.
Growth drivers
| # | Growth driver | Impact | Gross contribution (USD Million) | 2026-28 | 2029-31 | 2032-34 |
|---|---|---|---|---|---|---|
| 1 | Rising biologics and antibody pipeline | High | +330 | High | High | Medium |
| 2 | Lower cost of goods and smaller plant footprint | Medium-High | +250 | High | High | Medium |
| 3 | Single-use and in-line analytics maturity | Medium-High | +190 | High | Medium | Medium |
| 4 | Regulatory support and contract manufacturing capacity build | Medium | +140 | Medium | High | Medium |
| 5 | Cell and gene therapy production | Medium | +60 | Low | Medium | High |
| 6 | Others | Low | +40 | Low | Low | Low |
| Total | +1010 | |||||
Restraints
| # | Restraint | Impact | Estimated reduction (USD Million) | 2026-28 | 2029-31 | 2032-34 |
|---|---|---|---|---|---|---|
| 1 | Validation and regulatory re-filing burden | Medium-High | −70 | High | Medium | Medium |
| 2 | Capital cost of replacing batch assets | Medium | −50 | Medium | Medium | Low |
| 3 | Contamination risk and skills gaps | Low | −30 | Medium | Low | Low |
| Total | −150 | |||||
Drivers contribute 1010 USD Million and restraints remove 150 USD Million, a net 860 USD Million, which is the revenue the market adds between the base year and 2034. Contributions are CDI estimates, apportioned so that they reconcile with the forecast rather than being read from it.
Separate the 14.33% into its parts and three show up: an already-large base compounding, the product mix moving toward its faster lines, and regional growth landing unevenly.
Restraining Factors
The bear case and what drives it
Market Restraints
2- 01The bear case and what drives it
Conversion stalls on validation cost and sourcing risk, consumable prices fall faster than volumes grow, and capital budgets at sponsors tighten, delaying commercial filings. On that assumption 2034 revenue lands at USD 940 million against the USD 1220 million base case, from the same USD 360 million 2025 starting point.
- 02The largest line is not the fastest
With 24% of 2025 revenue (USD 86.4 million) Chromatography Systems & Consumables is where most of the market sits, and it grows at only 12% against the market's 14.33%. Revenue still reaches USD 244 million by 2034 and share still falls to 20%: a drag on the average, not a decline.
Market Opportunities
Upside case: USD 1440 million by 2034
Market Opportunities
2- 01Upside case: USD 1440 million by 2034
Regulators clarify continuous control expectations early, conversion of existing antibody plants speeds up, and cell and gene therapy launches arrive sooner, lifting adoption across all regions. On that assumption the market reaches USD 1440 million by 2034 against USD 1220 million in the base case, from the same USD 360 million in 2025.
- 02The opening is on the product axis, not the regional one
Share on the product axis moves toward Process Analytics & Control Systems, from 11% in 2025 to 16% in 2034, on 19% growth against the market's 14.33% and revenue rising from USD 39.6 million to USD 195.2 million. Taking position there does not require displacing whoever holds Chromatography Systems & Consumables, which is the harder and more expensive fight.
Market Challenges
Concentration on the product axis
Market Challenges
2- 01Concentration on the product axis
Chromatography Systems & Consumables is 24% of 2025 revenue at USD 86.4 million and still 20% at USD 244 million in 2034. Anything that changes demand for it changes the headline number; nothing else on the axis carries that weight.
- 02The United States is 87.79% of North America
Of North America's USD 145.8 million in 2025, USD 128 million (87.79%) comes from the United States alone, rising to USD 380 million by 2034. Regional totals therefore move largely with one country's demand, so a regional forecast is more exposed to single-country conditions than its size alone suggests.
Segmentation Analysis
10 axesSegmentation runs along ten axes: product, process stage, application, end user, operation mode, technology platform, scale of operation, expression system, chromatography mode and ownership model. Each axis cuts the same total revenue along a different commercial dimension, so the splits are alternative views of one market, not additions to it.
Seven product lines are reported. Two of them take share over the forecast period and the rest give it up, though every line grows in absolute terms between 2025 and 2034.
By Product · 7 segments
By Product
- Largest Chromatography Systems & Consumables · 24%
- Fastest Process Analytics & Control Systems · 19%
- Moves most Process Analytics & Control Systems · +5 pts
- Order by 2034 changes
| Segment | 2025 | Share | 2034 | Share | CAGR |
|---|---|---|---|---|---|
| Chromatography Systems & Consumables | $86.40M | 24% | $244M | 20%-4 | 12% |
| Filtration Systems & Devices | $79.20M | 22% | $244M | 20%-2 | 13.1% |
| Bioreactors | $64.80M | 18% | $207M | 17%-1 | 13.6% |
| Cell Culture Media | $43.20M | 12% | $146M | 12% | 14.3% |
| Buffers & Reagents | $28.80M | 8% | $97.60M | 8% | 14.3% |
| Process Analytics & Control Systems | $39.60M | 11% | $195M | 16%+5 | 19% |
| Cell Retention Devices | $18M | 5% | $85.40M | 7%+2 | 18.9% |
2025 to 2034 revenue and share by line: Chromatography Systems & Consumables USD 86.4 million to USD 244 million (24% to 20%), Filtration Systems & Devices USD 79.2 million to USD 244 million (22% to 20%), Bioreactors USD 64.8 million to USD 207.4 million (18% to 17%), Cell Culture Media USD 43.2 million to USD 146.4 million (12% to 12%), Process Analytics & Control Systems USD 39.6 million to USD 195.2 million (11% to 16%), Buffers & Reagents USD 28.8 million to USD 97.6 million (8% to 8%), Cell Retention Devices USD 18 million to USD 85.4 million (5% to 7%). Process Analytics & Control Systems Outpaces the Axis While Chromatography Systems & Consumables Holds the Largest Share Chromatography and filtration lead because every continuous train needs capture and polishing steps, and the consumables are replaced on a fixed cycle, so spend recurs with each campaign. Process analytics and control grows fastest in the forecast because running a perfusion or multicolumn train for weeks depends on in-line sensing and automated feedback, and few plants retrofit that layer onto batch equipment. Chromatography Systems & Consumables remains the largest line through 2034, so the axis changes in proportion, not in order. This is the axis the estimation prices in full, year by year, and the one the regional chapters cut against.
By Process Stage · 3 segments
Downstream Led by Process stage in 2025, with Integrated End-to-End Growing Fastest
- Largest Downstream · 48%
- Fastest Integrated End-to-End · 21.2%
- Moves most Integrated End-to-End · +8 pts
- Order by 2034 unchanged
| Segment | 2025 | Share | 2034 | Share | CAGR |
|---|---|---|---|---|---|
| Upstream | $144M | 40% | $439M | 36%-4 | 13.2% |
| Downstream | $173M | 48% | $537M | 44%-4 | 13.4% |
| Integrated End-to-End | $43.20M | 12% | $244M | 20%+8 | 21.2% |
Downstream leads because purification is the costliest and most capacity-constrained part of a biologics train, and multicolumn capture reduces resin and buffer use per gram. Integrated end-to-end grows fastest as sponsors move from intensifying single steps to linking perfusion directly into continuous capture and polishing, which removes hold tanks and shortens the path from cell culture to drug substance. Downstream remains the largest line through 2034, so the axis changes in proportion, not in order.
By Application · 6 segments
Scale in Monoclonal Antibodies and Growth in Cell & Gene Therapy Define the Application Axis
- Largest Monoclonal Antibodies · 48%
- Fastest Cell & Gene Therapy · 27.4%
- Moves most Cell & Gene Therapy · +8 pts
- Order by 2034 unchanged
| Segment | 2025 | Share | 2034 | Share | CAGR |
|---|---|---|---|---|---|
| Monoclonal Antibodies | $173M | 48% | $512M | 42%-6 | 12.8% |
| Vaccines | $43.20M | 12% | $159M | 13%+1 | 15.5% |
| Cell & Gene Therapy | $18M | 5% | $159M | 13%+8 | 27.4% |
| Recombinant Proteins | $61.20M | 17% | $171M | 14%-3 | 12.1% |
| Biosimilars | $50.40M | 14% | $171M | 14% | 14.5% |
| Other Applications | $14.40M | 4% | $48.80M | 4% | 14.5% |
Monoclonal antibodies lead because most commercial perfusion and multicolumn capacity was installed for antibody programmes, where titres and demand justify the changeover. Cell and gene therapy grows fastest from a small base, since viral vector and cell production favour small, closed, continuous formats that avoid repeated batch set-up. Monoclonal Antibodies remains the largest line through 2034, so the axis changes in proportion, not in order.
By End User · 4 segments
Contract Development & Manufacturing Organizations Outpaces the Axis While Pharmaceutical & Biotechnology Companies Holds the Largest Share
- Largest Pharmaceutical & Biotechnology Companies · 62%
- Fastest Contract Development & Manufacturing Organizations · 17.4%
- Moves most Pharmaceutical & Biotechnology Companies · -6 pts
- Order by 2034 unchanged
| Segment | 2025 | Share | 2034 | Share | CAGR |
|---|---|---|---|---|---|
| Pharmaceutical & Biotechnology Companies | $223M | 62% | $683M | 56%-6 | 13.2% |
| Contract Development & Manufacturing Organizations | $86.40M | 24% | $366M | 30%+6 | 17.4% |
| Contract Research Organizations | $21.60M | 6% | $73.20M | 6% | 14.5% |
| Academic & Research Institutes | $28.80M | 8% | $97.60M | 8% | 14.5% |
Pharmaceutical and biotechnology companies lead because they own the commercial products and the capital budgets for process conversion. Contract manufacturers grow fastest as sponsors without internal continuous expertise buy access to intensified suites, and as outsourcers compete on lower cost of goods for clients that need flexible capacity. Pharmaceutical & Biotechnology Companies remains the largest line through 2034, so the axis changes in proportion, not in order.
By Operation Mode · 3 segments
Fully Continuous Outpaces the Axis While Perfusion with Intensified Fed-Batch Holds the Largest Share
- Largest Perfusion with Intensified Fed-Batch · 48%
- Fastest Fully Continuous · 21.2%
- Moves most Perfusion with Intensified Fed-Batch · -16 pts
- Order by 2034 changes
| Segment | 2025 | Share | 2034 | Share | CAGR |
|---|---|---|---|---|---|
| Fully Continuous | $64.80M | 18% | $366M | 30%+12 | 21.2% |
| Hybrid (Semi-Continuous) | $122M | 34% | $464M | 38%+4 | 15.9% |
| Perfusion with Intensified Fed-Batch | $173M | 48% | $390M | 32%-16 | 9.5% |
Perfusion with intensified fed-batch leads because it fits existing stainless and single-use assets and needs the least regulatory re-filing. Fully continuous operation grows fastest as downstream equipment matures and regulators publish clearer expectations for continuous process control, allowing sponsors to connect all unit operations under one control strategy. Leadership changes hands: Hybrid (Semi-Continuous) is the largest line by 2034, not Perfusion with Intensified Fed-Batch.
By Technology Platform · 3 segments
Single-Use Held the Dominant Share of the Technology platform Segment in 2025
- Largest Single-Use · 56%
- Fastest Hybrid Single-Use/Stainless · 16.9%
- Moves most Stainless Steel · -10 pts
- Order by 2034 changes
| Segment | 2025 | Share | 2034 | Share | CAGR |
|---|---|---|---|---|---|
| Single-Use | $202M | 56% | $756M | 62%+6 | 15.8% |
| Stainless Steel | $86.40M | 24% | $171M | 14%-10 | 7.9% |
| Hybrid Single-Use/Stainless | $72M | 20% | $293M | 24%+4 | 16.9% |
Single-use leads because disposable flow paths cut cleaning validation and changeover time, which matters most in the small, frequent campaigns that continuous processes run. Hybrid single-use and stainless grows fastest as large plants keep fixed vessels for media and buffer preparation while adopting disposable perfusion and capture modules. Single-Use remains the largest line through 2034, so the axis changes in proportion, not in order.
By Scale of Operation · 3 segments
Commercial Scale Holds the Largest Scale of operation Share and Is Still the Quickest to Grow
- Largest Commercial Scale · 50%
- Fastest Commercial Scale · 16.9%
- Moves most Commercial Scale · +10 pts
- Order by 2034 unchanged
| Segment | 2025 | Share | 2034 | Share | CAGR |
|---|---|---|---|---|---|
| Research & Process Development Scale | $79.20M | 22% | $195M | 16%-6 | 10.5% |
| Pilot Scale | $101M | 28% | $293M | 24%-4 | 12.6% |
| Commercial Scale | $180M | 50% | $732M | 60%+10 | 16.9% |
Commercial scale leads because installed continuous trains at commercial sites consume the largest volumes of consumables and the highest value systems. It also grows fastest as pilot demonstrations convert into licensed commercial processes, while research scale expands more slowly because small development labs can often run intensified batch experiments with existing equipment. The order does not change: Commercial Scale is still largest in 2034, and what moves is how much it holds.
By Expression System · 4 segments
Cell-Free Systems Outpaces the Axis While Mammalian Cells Holds the Largest Share
- Largest Mammalian Cells · 76%
- Fastest Cell-Free Systems · 18.2%
- Moves most Mammalian Cells · -2 pts
- Order by 2034 unchanged
| Segment | 2025 | Share | 2034 | Share | CAGR |
|---|---|---|---|---|---|
| Mammalian Cells | $274M | 76% | $903M | 74%-2 | 14.2% |
| Microbial | $61.20M | 17% | $207M | 17% | 14.5% |
| Insect Cells | $14.40M | 4% | $61M | 5%+1 | 17.4% |
| Cell-Free Systems | $10.80M | 3% | $48.80M | 4%+1 | 18.2% |
Mammalian cells lead because antibodies and most complex biologics are made in them, and perfusion culture was developed around those cell lines. Cell-free systems grow fastest from a very small base as developers test rapid, continuous production of difficult proteins and nucleic acid products that do not suit living hosts. By 2034 Mammalian Cells is still ahead, making this a shift in weight, not a change of leader.
By Chromatography Mode · 5 segments
Periodic Countercurrent Chromatography Held the Dominant Share of the Chromatography mode Segment in 2025
- Largest Periodic Countercurrent Chromatography · 36%
- Fastest Continuous Annular Chromatography · 18.2%
- Moves most Simulated Moving Bed · -4 pts
- Order by 2034 unchanged
| Segment | 2025 | Share | 2034 | Share | CAGR |
|---|---|---|---|---|---|
| Multicolumn Countercurrent Solvent Gradient | $28.80M | 8% | $122M | 10%+2 | 17.4% |
| Periodic Countercurrent Chromatography | $130M | 36% | $415M | 34%-2 | 13.8% |
| Simulated Moving Bed | $79.20M | 22% | $220M | 18%-4 | 12% |
| Continuous Annular Chromatography | $21.60M | 6% | $97.60M | 8%+2 | 18.2% |
| Other Continuous Modes | $101M | 28% | $366M | 30%+2 | 15.4% |
Periodic countercurrent chromatography leads because it is the most widely validated way to run protein A capture continuously on standard column hardware. Continuous annular and multicolumn solvent gradient modes grow fastest because they extend continuous purification to polishing steps and to products that need gradient separation, where batch columns are least efficient. The order does not change: Periodic Countercurrent Chromatography is still largest in 2034, and what moves is how much it holds.
By Ownership Model · 2 segments
In-House Manufacturing Held the Dominant Share of the Ownership model Segment in 2025
- Largest In-House Manufacturing · 62%
- Fastest Outsourced Manufacturing · 16.4%
- Moves most In-House Manufacturing · -6 pts
- Order by 2034 unchanged
| Segment | 2025 | Share | 2034 | Share | CAGR |
|---|---|---|---|---|---|
| In-House Manufacturing | $223M | 62% | $683M | 56%-6 | 13.2% |
| Outsourced Manufacturing | $137M | 38% | $537M | 44%+6 | 16.4% |
In-house manufacturing leads because large sponsors prefer to keep process knowledge and control of commercial supply on their own sites. Outsourced manufacturing grows fastest as smaller developers and cell therapy companies avoid the capital cost of intensified plants and rent capacity from providers that have already validated continuous processes. In-House Manufacturing remains the largest line through 2034, so the axis changes in proportion, not in order.
Regional Insights
Regional Revenue Share
Base year 2025Share of global revenue in the base year.
Only the leading region's share is published outside the report; pins mark the region, not a specific country.
North America Market Analysis
The largest region covered — 4.5 points of share move elsewhere by 2034, while revenue still grows 3.0×.
- Rank 1 of 5
- 2025 share 40.5%
- By 2034 36%
- Revenue $146M → $439M
USD 145.8 million of 2025 revenue is generated in North America, 40.5% of the global continuous bioprocessing market on the way to USD 439.2 million by 2034. That makes it the first-largest region covered, in 2025 and again in 2034.
By 2034 the share stands at 36%, a shift in share, not in direction: revenue climbs every year while the market's centre of gravity moves elsewhere.
Chromatography Systems & Consumables leads here as it does globally, at 24% of 2025 revenue, and Process Analytics & Control Systems again grows fastest at 19%. The full report breaks North America out along every axis and by country.
United States
Sets the pace for North America at 87.8% of it, growing 3.0×.
- In region 1 of 2
- Of region 87.8%
- Of global 35.6%
- Revenue $128M → $380M
87.79% of North America's base-year revenue comes from the United States; USD 128 million, rising to USD 380 million by 2034. At 87.79% of regional revenue in the base year it is not one market among several, the region's trajectory is largely this country's trajectory. Set against USD 145.8 million and USD 439.2 million for the region, it is why this market, and not a smaller one, is the one reported in full.
Demand in the United States follows the product mix reported at global level: Chromatography Systems & Consumables is the largest line at 24% of 2025 revenue, moving to 20% by 2034, while Process Analytics & Control Systems grows fastest at 19% and takes its share from 11% to 16%. Because the country carries 87.79% of North America, a movement in its own mix shows up in the regional totals instead of being averaged away by neighbouring markets. The full report reports the United States by product separately.
Continuous bioprocessing equipment itself is not separately cleared in the United States; oversight attaches to the biologic or drug made with it. The Food and Drug Administration, through its Center for Drug Evaluation and Research and Center for Biologics Evaluation and Research, reviews manufacturing changes inside a marketing application. The agency has published an emerging technology program and guidance on advanced manufacturing that encourage early engagement on continuous processes. Suppliers of single-use assemblies, sensors and control software answer to current good manufacturing practice, process validation expectations, and data integrity rules for electronic records. Equipment makers typically document extractables, leachables and software validation so that their customers can file.
In the United States the field is Danaher Corporation (Cytiva), Sartorius AG, Thermo Fisher Scientific Inc., Merck KGaA, Repligen Corporation, Agilent Technologies, Inc., Bio-Rad Laboratories, Inc., Pall Corporation, Eppendorf SE, Lonza Group AG, Sartorius Stedim Biotech S.A., Asahi Kasei Corporation, Avantor, Inc., Corning Incorporated, Tosoh Bioscience LLC, Purolite (Ecolab Inc.), Getinge AB, Parker Hannifin Corporation, PBS Biotech, Inc., Applikon Biotechnology (Getinge), Alfa Laval AB, Lab Armor Solutions, Samsung Biologics Co., Ltd., WuXi Biologics (Cayman) Inc., Boehringer Ingelheim BioXcellence, FUJIFILM Diosynth Biotechnologies, Univercells Technologies S.A., Cellares Corporation, Novasep Holding SAS, YMC Co., Ltd., Bioengineering AG and Tarpon Biosystems, Inc.. Chromatography Systems & Consumables, at 24% of 2025 revenue, is where the volume sits, and Process Analytics & Control Systems, growing at 19%, is where position changes hands over the forecast period. Country-level positioning and shares for each of these companies are part of the full report, not of this summary.
Canada
2nd-largest in North America, growing 3.1×.
- In region 2 of 2
- Of region 9.6%
- Of global 3.9%
- Revenue $14M → $44M
Canada is sized at USD 14 million in 2025, rising to USD 44 million by 2034; 3.89% of global revenue and 9.6% of North America. It is reported separately from the United States across every segmentation axis in the full report.
Europe Market Analysis
The 2nd-largest region covered — 1.6 points of share move elsewhere by 2034, while revenue still grows 3.2×.
- Rank 2 of 5
- 2025 share 28%
- By 2034 26.4%
- Revenue $101M → $322M
In Europe, 28% of global revenue puts 2025 at USD 100.8 million and reaches USD 322.08 million by 2034. Among the five regions it ranks second by revenue in both years.
Share settles at 26.4% in 2034, a shift in share, not in direction: revenue climbs every year while the market's centre of gravity moves elsewhere.
Segment composition follows the global pattern: Chromatography Systems & Consumables largest at 24% of 2025 revenue, Process Analytics & Control Systems fastest at 19%. Per-axis and per-country detail for Europe sits in the full report.
Germany
The largest market in Europe, growing 2.9×.
- In region 1 of 3
- Of region 29.8%
- Of global 8.3%
- Revenue $30M → $88M
USD 30 million of Europe's 2025 revenue is generated in Germany, the region's largest market, reaching USD 88 million by 2034. It accounts for 29.76% of regional revenue in the base year, the largest single share without dominating the region outright. Regional revenue of USD 100.8 million in 2025 and USD 322.08 million in 2034 sits around it, and it is the country used wherever the full report cuts a figure by geography.
The product pattern in Germany is the global one: 24% of 2025 revenue in Chromatography Systems & Consumables, 20% by 2034, against 19% growth in Process Analytics & Control Systems taking it from 11% to 16%. Because the country carries 29.76% of Europe, a movement in its own mix shows up in the regional totals instead of being averaged away by neighbouring markets. Revenue by product for Germany is reported separately in the full report.
In Germany, continuous bioprocessing falls under the European medicines framework, with national enforcement shared between the Paul-Ehrlich-Institut for biologics and the federal and state authorities that inspect manufacturing sites. Medicinal product makers must hold a manufacturing authorisation and follow European good manufacturing practice, including the annex on biological active substances. Process changes are assessed through variation procedures, and the European Medicines Agency accepts continuous manufacturing within a marketing dossier. Equipment suppliers are not licensed as such, but must show conformity with applicable machinery and pressure equipment rules, CE marking where relevant, and documentation supporting qualification, cleaning validation and data integrity at the customer site.
In Germany the field is Danaher Corporation (Cytiva), Sartorius AG, Thermo Fisher Scientific Inc., Merck KGaA, Repligen Corporation, Agilent Technologies, Inc., Bio-Rad Laboratories, Inc., Pall Corporation, Eppendorf SE, Lonza Group AG, Sartorius Stedim Biotech S.A., Asahi Kasei Corporation, Avantor, Inc., Corning Incorporated, Tosoh Bioscience LLC, Purolite (Ecolab Inc.), Getinge AB, Parker Hannifin Corporation, PBS Biotech, Inc., Applikon Biotechnology (Getinge), Alfa Laval AB, Lab Armor Solutions, Samsung Biologics Co., Ltd., WuXi Biologics (Cayman) Inc., Boehringer Ingelheim BioXcellence, FUJIFILM Diosynth Biotechnologies, Univercells Technologies S.A., Cellares Corporation, Novasep Holding SAS, YMC Co., Ltd., Bioengineering AG and Tarpon Biosystems, Inc.. Volume sits in Chromatography Systems & Consumables at 24% of 2025 revenue; movement sits in Process Analytics & Control Systems at 19% growth. The commercial size of that position is USD 100.8 million in 2025, moving to USD 322.08 million by 2034 across the forecast period.
United Kingdom
2nd-largest in Europe, growing 3.1×.
- In region 2 of 3
- Of region 17.9%
- Of global 5%
- Revenue $18M → $55M
Within Europe, the United Kingdom accounts for 17.86% of regional revenue and 5% of the global total, worth USD 18 million in 2025 and USD 55 million by 2034.
France
3rd-largest in Europe, growing 2.9×.
- In region 3 of 3
- Of region 13.9%
- Of global 3.9%
- Revenue $14M → $40M
France is sized at USD 14 million in 2025, rising to USD 40 million by 2034; 3.89% of global revenue and 13.89% of Europe. It is reported separately from Germany across every segmentation axis in the full report.
Asia Pacific Market Analysis
The 3rd-largest region covered, and the one gaining the most — it picks up 6.3 points of share by 2034, while revenue still grows 4.4×.
- Rank 3 of 5
- 2025 share 22%
- By 2034 28.3%
- Revenue $79.20M → $345M
In Asia Pacific, 22% of global revenue puts 2025 at USD 79.2 million on the way to USD 345.26 million by 2034. By revenue it sits third across the study, and the ranking does not change between 2025 and 2034.
28.3% of global revenue sits here by 2034, up from the 2025 level, on growth above the market's own 14.33%, and with a bigger contribution to the revenue added over the period than the base-year figure suggests.
Segment composition follows the global pattern: Chromatography Systems & Consumables largest at 24% of 2025 revenue, Process Analytics & Control Systems fastest at 19%. Per-axis and per-country detail for Asia Pacific sits in the full report.
China
The largest market in Asia Pacific, growing 4.7×.
- In region 1 of 3
- Of region 37.9%
- Of global 8.3%
- Revenue $30M → $140M
The largest single market in Asia Pacific is China, at USD 30 million in 2025 and USD 140 million in 2034. 37.88% of the region in the base year makes it the largest market here without making it the region. The region itself runs USD 79.2 million to USD 345.26 million over the same period, and this is the market carrying the country-level detail in the full report.
The product pattern in China is the global one: 24% of 2025 revenue in Chromatography Systems & Consumables, 20% by 2034, against 19% growth in Process Analytics & Control Systems taking it from 11% to 16%. With 37.88% of Asia Pacific concentrated here, a change in this country's mix is visible in the regional figures instead of being diluted by its neighbours. China carries its own product breakdown in the full report.
China regulates biologics manufactured by continuous processes through the National Medical Products Administration and its Center for Drug Evaluation. Marketing authorisation holders carry responsibility under the Drug Administration Law, and manufacturers must comply with the national good manufacturing practice standard, including its annex for biological products. Regulators have aligned increasingly with International Council for Harmonisation guidance, which gives continuous manufacturing a recognised path in applications. Imported and domestic equipment is not approved separately as a drug, but suppliers must meet national standards for pressure vessels, electrical safety and materials, and customers expect validation packages, supplier audits and traceable batch records before installation in a regulated facility.
In China the field is Danaher Corporation (Cytiva), Sartorius AG, Thermo Fisher Scientific Inc., Merck KGaA, Repligen Corporation, Agilent Technologies, Inc., Bio-Rad Laboratories, Inc., Pall Corporation, Eppendorf SE, Lonza Group AG, Sartorius Stedim Biotech S.A., Asahi Kasei Corporation, Avantor, Inc., Corning Incorporated, Tosoh Bioscience LLC, Purolite (Ecolab Inc.), Getinge AB, Parker Hannifin Corporation, PBS Biotech, Inc., Applikon Biotechnology (Getinge), Alfa Laval AB, Lab Armor Solutions, Samsung Biologics Co., Ltd., WuXi Biologics (Cayman) Inc., Boehringer Ingelheim BioXcellence, FUJIFILM Diosynth Biotechnologies, Univercells Technologies S.A., Cellares Corporation, Novasep Holding SAS, YMC Co., Ltd., Bioengineering AG and Tarpon Biosystems, Inc.. Chromatography Systems & Consumables, at 24% of 2025 revenue, is where the volume sits, and Process Analytics & Control Systems, growing at 19%, is where position changes hands over the forecast period. A supplier weighted toward Asia Pacific is competing over a base of USD 79.2 million in 2025 reaching USD 345.26 million by 2034, 22% of global revenue at the start of that period.
Japan
2nd-largest in Asia Pacific, growing 3.0×.
- In region 2 of 3
- Of region 18.9%
- Of global 4.2%
- Revenue $15M → $45M
Within Asia Pacific, Japan accounts for 18.94% of regional revenue and 4.17% of the global total, worth USD 15 million in 2025 and USD 45 million by 2034.
South Korea
3rd-largest in Asia Pacific, growing 3.8×.
- In region 3 of 3
- Of region 12.6%
- Of global 2.8%
- Revenue $10M → $38M
Within Asia Pacific, South Korea accounts for 12.63% of regional revenue and 2.78% of the global total, worth USD 10 million in 2025 and USD 38 million by 2034.
Latin America Market Analysis
The 5th-largest region covered, holding its share flat through 2034, while revenue still grows 3.4×.
- Rank 5 of 5
- 2025 share 4.3%
- By 2034 4.3%
- Revenue $15.48M → $52.46M
USD 15.48 million of 2025 revenue is generated in Latin America, 4.3% of the global continuous bioprocessing market rising to USD 52.46 million in 2034. By revenue it sits fifth across the study, and the ranking does not change between 2025 and 2034.
Its share moves to 4.3% by 2034, though revenue still rises throughout; the shift is in the region's weight against faster-growing ones, which is not the same as weakening demand.
Segment composition follows the global pattern: Chromatography Systems & Consumables largest at 24% of 2025 revenue, Process Analytics & Control Systems fastest at 19%. Revenue for Latin America is broken out by every segmentation axis and by country in the full report.
Brazil
The largest market in Latin America, growing 3.4×.
- In region 1 of 2
- Of region 51.7%
- Of global 2.2%
- Revenue $8M → $27M
51.68% of Latin America's base-year revenue comes from Brazil; USD 8 million, rising to USD 27 million by 2034. Its 51.68% of base-year regional revenue leads the region, though enough sits elsewhere that Latin America is not a proxy for it. Regional revenue of USD 15.48 million in 2025 and USD 52.46 million in 2034 sits around it, and it is the country used wherever the full report cuts a figure by geography.
The product pattern in Brazil is the global one: 24% of 2025 revenue in Chromatography Systems & Consumables, 20% by 2034, against 19% growth in Process Analytics & Control Systems taking it from 11% to 16%. Because the country carries 51.68% of Latin America, a movement in its own mix shows up in the regional totals instead of being averaged away by neighbouring markets. The full report reports Brazil by product separately.
In Brazil, the National Health Surveillance Agency, known as Anvisa, regulates biological medicines and the facilities that produce them. Manufacturers need an operating authorisation and a certificate of good manufacturing practice, which Anvisa grants after inspection and which follows its own resolutions aligned with international norms. Registration of a biologic, or a post-registration change that introduces continuous production, is submitted with comparability and validation evidence. Anvisa participates in the International Council for Harmonisation and the Pharmaceutical Inspection Co-operation Scheme, so harmonised guidance carries weight. Equipment suppliers are not registered as drug makers, but their customers rely on qualification documents, material certificates and conformity with local electrical and metrology requirements.
Danaher Corporation (Cytiva), Sartorius AG, Thermo Fisher Scientific Inc., Merck KGaA, Repligen Corporation, Agilent Technologies, Inc., Bio-Rad Laboratories, Inc., Pall Corporation, Eppendorf SE, Lonza Group AG, Sartorius Stedim Biotech S.A., Asahi Kasei Corporation, Avantor, Inc., Corning Incorporated, Tosoh Bioscience LLC, Purolite (Ecolab Inc.), Getinge AB, Parker Hannifin Corporation, PBS Biotech, Inc., Applikon Biotechnology (Getinge), Alfa Laval AB, Lab Armor Solutions, Samsung Biologics Co., Ltd., WuXi Biologics (Cayman) Inc., Boehringer Ingelheim BioXcellence, FUJIFILM Diosynth Biotechnologies, Univercells Technologies S.A., Cellares Corporation, Novasep Holding SAS, YMC Co., Ltd., Bioengineering AG and Tarpon Biosystems, Inc. are the suppliers covered in Brazil. The commercially relevant division is 24% of 2025 revenue in Chromatography Systems & Consumables, where the volume is, against 19% growth in Process Analytics & Control Systems, where share moves. The commercial size of that position is USD 15.48 million in 2025, moving to USD 52.46 million by 2034 across the forecast period.
Mexico
2nd-largest in Latin America, growing 3.3×.
- In region 2 of 2
- Of region 19.4%
- Of global 0.8%
- Revenue $3M → $10M
Mexico is sized at USD 3 million in 2025, rising to USD 10 million by 2034; 0.83% of global revenue and 19.38% of Latin America. It is reported separately from Brazil across every segmentation axis in the full report.
Middle East and Africa Market Analysis
The 4th-largest region covered — 0.2 points of share move elsewhere by 2034, while revenue still grows 3.3×.
- Rank 4 of 5
- 2025 share 5.2%
- By 2034 5%
- Revenue $18.72M → $61M
In Middle East and Africa, 5.2% of global revenue puts 2025 at USD 18.72 million with USD 61 million projected for 2034. Among the five regions it ranks fourth by revenue in both years.
Its share moves to 5% by 2034, though revenue still rises throughout; the shift is in the region's weight against faster-growing ones, which is not the same as weakening demand.
Chromatography Systems & Consumables leads here as it does globally, at 24% of 2025 revenue, and Process Analytics & Control Systems again grows fastest at 19%. Per-axis and per-country detail for Middle East and Africa sits in the full report.
Israel
The largest market in Middle East and Africa, growing 3.2×.
- In region 1 of 2
- Of region 26.7%
- Of global 1.4%
- Revenue $5M → $16M
USD 5 million of Middle East and Africa's 2025 revenue is generated in Israel, the region's largest market, reaching USD 16 million by 2034. 26.71% of the region in the base year makes it the largest market here without making it the region. Set against USD 18.72 million and USD 61 million for the region, it is why this market, and not a smaller one, is the one reported in full.
The product pattern in Israel is the global one: 24% of 2025 revenue in Chromatography Systems & Consumables, 20% by 2034, against 19% growth in Process Analytics & Control Systems taking it from 11% to 16%. Its 26.71% weight in Middle East and Africa means those movements carry straight into the regional totals. Revenue by product for Israel is reported separately in the full report.
Israel places pharmaceutical and biologic manufacturing under the Ministry of Health, whose pharmaceutical division registers medicines and licenses manufacturing sites. Producers must follow good manufacturing practice consistent with European and Pharmaceutical Inspection Co-operation Scheme standards, and changes to a registered process, such as adopting continuous operation, are reviewed as variations with supporting validation data. Many Israeli producers also file with the Food and Drug Administration or the European Medicines Agency, so dossiers tend to meet those expectations as well. Equipment suppliers are not separately licensed, but must satisfy national standards institute requirements for electrical and mechanical safety and supply qualification documentation, material declarations and software validation records.
Danaher Corporation (Cytiva), Sartorius AG, Thermo Fisher Scientific Inc., Merck KGaA, Repligen Corporation, Agilent Technologies, Inc., Bio-Rad Laboratories, Inc., Pall Corporation, Eppendorf SE, Lonza Group AG, Sartorius Stedim Biotech S.A., Asahi Kasei Corporation, Avantor, Inc., Corning Incorporated, Tosoh Bioscience LLC, Purolite (Ecolab Inc.), Getinge AB, Parker Hannifin Corporation, PBS Biotech, Inc., Applikon Biotechnology (Getinge), Alfa Laval AB, Lab Armor Solutions, Samsung Biologics Co., Ltd., WuXi Biologics (Cayman) Inc., Boehringer Ingelheim BioXcellence, FUJIFILM Diosynth Biotechnologies, Univercells Technologies S.A., Cellares Corporation, Novasep Holding SAS, YMC Co., Ltd., Bioengineering AG and Tarpon Biosystems, Inc. are the suppliers covered in Israel. Chromatography Systems & Consumables, at 24% of 2025 revenue, is where the volume sits, and Process Analytics & Control Systems, growing at 19%, is where position changes hands over the forecast period. The commercial size of that position is USD 18.72 million in 2025 and USD 61 million by 2034, 5.2% of the global total in the base year.
Saudi Arabia
2nd-largest in Middle East and Africa, growing 3.8×.
- In region 2 of 2
- Of region 21.4%
- Of global 1.1%
- Revenue $4M → $15M
Saudi Arabia is sized at USD 4 million in 2025, rising to USD 15 million by 2034; 1.11% of global revenue and 21.37% of Middle East and Africa. It is reported separately from Israel across every segmentation axis in the full report.
Request this sample to see the full data tables and segment-level detail behind this analysis.
Report Coverage
This report assesses the market across every segment, with revenue and a growth rate for each line in each year of the study period. It covers the drivers, trends, opportunities, restraints and challenges shaping growth, the competitive landscape and the companies profiled, and the research methodology behind every estimate. Segmentation is reported by Product, Process Stage, Application, End User, Operation Mode, Technology Platform, Scale of Operation, Expression System, Chromatography Mode, Ownership Model, and regional analysis covers North America, Europe, Asia Pacific, Latin America, Middle East and Africa, each broken out by country.
Competitive Landscape
Position on the Product Axis Decides Competitive Standing
Suppliers in scope: Danaher Corporation (Cytiva), Sartorius AG, Thermo Fisher Scientific Inc., Merck KGaA, Repligen Corporation, Agilent Technologies, Inc., Bio-Rad Laboratories, Inc., Pall Corporation, Eppendorf SE, Lonza Group AG, Sartorius Stedim Biotech S.A., Asahi Kasei Corporation, Avantor, Inc., Corning Incorporated, Tosoh Bioscience LLC, Purolite (Ecolab Inc.), Getinge AB, Parker Hannifin Corporation, PBS Biotech, Inc., Applikon Biotechnology (Getinge), Alfa Laval AB, Lab Armor Solutions, Samsung Biologics Co., Ltd., WuXi Biologics (Cayman) Inc., Boehringer Ingelheim BioXcellence, FUJIFILM Diosynth Biotechnologies, Univercells Technologies S.A., Cellares Corporation, Novasep Holding SAS, YMC Co., Ltd., Bioengineering AG and Tarpon Biosystems, Inc..
Competition follows the product split, not the regional one. The largest block of revenue is Chromatography Systems & Consumables: USD 86.4 million in 2025 at 24% of the total, 20% in 2034. Incumbency there is expensive to challenge. Process Analytics & Control Systems, compounding at 19% against 12% for Chromatography Systems & Consumables, is where share changes hands over the forecast period. A supplier positioned in one is not automatically positioned in the other, so a field of this size stays viable in a market of USD 360 million.
Suppliers separate on whether they can offer a complete, validated flow path from bioreactor to final filtration, since sponsors prefer one accountable vendor for a continuous train. The largest players hold broad consumables catalogues, installed bases that create recurring purchases, regulatory support files and global service networks. Smaller and regional suppliers compete on specialised modules such as cell retention devices, multicolumn skids and analytics, on faster customisation, and on lower prices for development-scale work. Supply reliability for resins, membranes and single-use bags also decides awards, because a continuous run cannot pause for a missing component.
The regional picture sets the entry cost: 40.5% of revenue is in North America and 28% in Europe, so a credible global position requires both, while Latin America at 4.3% can be served opportunistically.
Profiles, financials, shares and development histories for each company sit in the full report; this summary carries the structure only.
List of Key Continuous Bioprocessing Market Companies Profiled
32 companies profiled. Company profiles, including financials, product portfolios and recent developments, are part of the full report.
- Danaher Corporation (Cytiva)(United States)
- Sartorius AG(Germany)
- Thermo Fisher Scientific Inc.(United States)
- Merck KGaA(Germany)
- Repligen Corporation(United States)
- Agilent Technologies, Inc.(United States)
- Bio-Rad Laboratories, Inc.(United States)
- Pall Corporation(United States)
- Eppendorf SE(Germany)
- Lonza Group AG(Switzerland)
- Sartorius Stedim Biotech S.A.(France)
- Asahi Kasei Corporation(Japan)
- Avantor, Inc.(United States)
- Corning Incorporated(United States)
- Tosoh Bioscience LLC(Japan)
- Purolite (Ecolab Inc.)(United States)
- Getinge AB(Sweden)
- Parker Hannifin Corporation(United States)
- PBS Biotech, Inc.(United States)
- Applikon Biotechnology (Getinge)(Netherlands)
- Alfa Laval AB(Sweden)
- Lab Armor Solutions
- Samsung Biologics Co., Ltd.(South Korea)
- WuXi Biologics (Cayman) Inc.(China)
- Boehringer Ingelheim BioXcellence(Germany)
- FUJIFILM Diosynth Biotechnologies
- Univercells Technologies S.A.(Belgium)
- Cellares Corporation(United States)
- Novasep Holding SAS(France)
- YMC Co., Ltd.(Japan)
- Bioengineering AG(Switzerland)
- Tarpon Biosystems, Inc.(United States)
Geographic Coverage
Every market below is broken out separately in the report.
North America
3Europe
8Asia Pacific
12Latin America
3Middle East and Africa
4Key Insights
Report Scope
Study parameters & segmentationThis study covers market size and forecasts over the 2020–2034 period, segmentation across 10 axes (Product, Process Stage, Application, End User, Operation Mode, Technology Platform, Scale of Operation, Expression System, Chromatography Mode, Ownership Model), regional analysis for 5 regions and their constituent countries, a competitive landscape profiling 32 key companies, and the research methodology behind every estimate.
Segmentation
10 axes + regionQuestions This Report Answers
6 questionsWhat is the market size and growth rate, globally and by region?
How is the market segmented, and which segments lead?
Which regions and countries are covered, and how do they compare?
What are the key drivers, restraints, opportunities and challenges?
Who are the leading companies operating in this market?
What trends are expected to shape the market through the forecast period?
Frequently Asked Questions
01What is the Continuous Bioprocessing Market projected to reach?
USD 1220 USD Million by 2034, CAGR 14.33%
02What years does this report cover?
Study period 2020–2034, base year 2025, historical data 2020-2024, forecast period 2026-2034.
03Which regions are covered?
North America, Europe, Asia Pacific, Latin America, Middle East and Africa.
04Which region accounted for the largest market share?
North America leads with 40.5% of global revenue through 2034.
05Which segment leads the market?
Chromatography Systems & Consumables is the largest line by Product, at 24% of revenue in 2025.
06Who are the key companies profiled?
Danaher Corporation (Cytiva), Sartorius AG, Thermo Fisher Scientific Inc., Merck KGaA, Repligen Corporation, Agilent Technologies, Inc., Bio-Rad Laboratories, Inc., Pall Corporation, Eppendorf SE, Lonza Group AG, Sartorius Stedim Biotech S.A., Asahi Kasei Corporation, Avantor, Inc., Corning Incorporated, Tosoh Bioscience LLC, Purolite (Ecolab Inc.), Getinge AB, Parker Hannifin Corporation, PBS Biotech, Inc., Applikon Biotechnology (Getinge), Alfa Laval AB, Lab Armor Solutions, Samsung Biologics Co., Ltd., WuXi Biologics (Cayman) Inc., Boehringer Ingelheim BioXcellence, FUJIFILM Diosynth Biotechnologies, Univercells Technologies S.A., Cellares Corporation, Novasep Holding SAS, YMC Co., Ltd., Bioengineering AG, Tarpon Biosystems, Inc.. Full profiles are part of the paid report.
07Can the segmentation be customized?
Yes. Custom data cuts by geography, segment, or competitor set are available on request.
Why choose CDI
Need this report shaped around your question?
The scope isn't fixed. Tell us what your team needs that the standard edition doesn't cover, and an analyst will come back on what can be adjusted and how long it takes, before you commit to anything.
Most licences include 30–60 hours of customization at no extra cost. See what each licence includes
Additional Companies
Add competitors, suppliers or the peer set you benchmark against to the companies already covered.
Deeper Competitive View
Sharpen the landscape work around your own position: product line, channel, or a named shortlist of rivals.
Extra Segment Splits
Break the market down along an axis the standard scope doesn't cut it by, or go a level deeper inside one.
Application Focus
Narrow the analysis to the specific use cases and end users your team actually sells into.
Different Time Frame
Move the base year, or widen the historical and forecast windows the study is built on.
Country-Level Detail
Go below region level into the individual countries that matter to you, rather than the standard geography split.