
Software Defined Vehicles MarketSize, Share & Industry Analysis, 2026-2034By OfferingBy Vehicle TypeBy PropulsionBy Level of AutonomyBy Sdv TypeBy ApplicationBy Electrical/electronic ArchitectureBy ConnectivityBy Sales ChannelBy Software Delivery Model
Full title & scope — all 10 axes with their segments
Software Defined Vehicles Market Size, Share & Industry Analysis, By Offering (Software, Hardware, Services), By Vehicle Type (Passenger Vehicles, Light Commercial Vehicles, Heavy Commercial Vehicles), By Propulsion (Internal Combustion Engine, Hybrid Electric Vehicle, Battery Electric Vehicle, Fuel Cell Electric Vehicle), By Level of Autonomy (Level 1, Level 2, Level 3, Level 4, Level 5), By Sdv Type (Semi-SDV, Fully SDV), By Application (Autonomous Driving and ADAS, Connected Services and Telematics, Infotainment and Cockpit, Powertrain and Chassis Control, Body and Comfort Electronics, Vehicle Security and Safety), By Electrical/electronic Architecture (Distributed Architecture, Domain-Centralized Architecture, Zonal Architecture, Central Compute Architecture), By Connectivity (Cellular, Wi-Fi, Bluetooth, Satellite, Ethernet In-Vehicle Network), By Sales Channel (OEM-Integrated, Aftermarket), By Software Delivery Model (Over-the-Air Updates, Features on Demand, Subscription Services, Embedded Perpetual Software), and Regional Forecast, 2026-2034
Market outlook, key takeaways, drivers and challenges for the report period.
- 01By OfferingSoftware · Hardware · Services
- 02By Vehicle TypePassenger Vehicles · Light Commercial Vehicles · Heavy Commercial Vehicles
- 03By PropulsionInternal Combustion Engine · Hybrid Electric Vehicle · Battery Electric Vehicle
- 04By Level of AutonomyLevel 1 · Level 2 · Level 3
- 05By Sdv TypeSemi-SDV · Fully SDV
- 06By ApplicationAutonomous Driving and ADAS · Connected Services and Telematics · Infotainment and Cockpit
- 07By Electrical/electronic ArchitectureDistributed Architecture · Domain-Centralized Architecture · Zonal Architecture
- 08By ConnectivityCellular · Wi-Fi · Bluetooth
- 09By Sales ChannelOEM-Integrated · Aftermarket
- 10By Software Delivery ModelOver-the-Air Updates · Features on Demand · Subscription Services
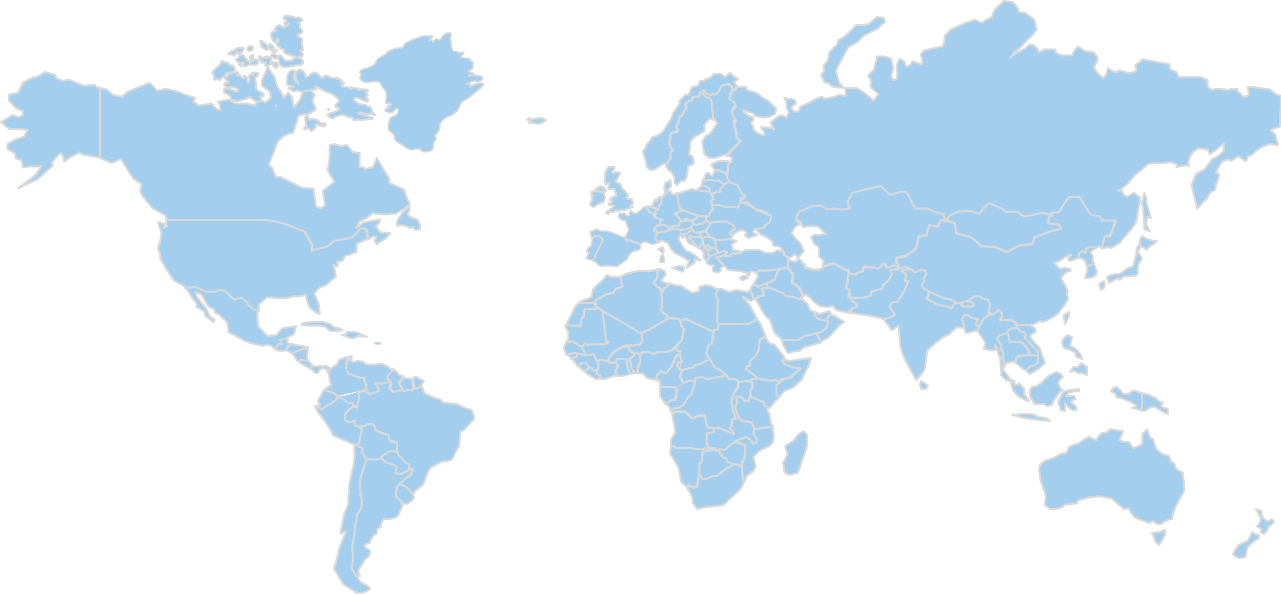
- 11By Region
Market Analysis & Outlook
A software-defined vehicle is a car or truck whose features, performance and updates are controlled mainly by software that runs on centralised computing hardware and can be changed after the vehicle is sold. The category covers the compute, sensor and network hardware that carries that software, and the services around it: integration, middleware, over-the-air delivery, data handling and subscription features. Buyers are automakers and their tier-one suppliers, with fleet operators and individual owners paying for features and updates after purchase.
Growth of 14.91% a year carries the global software defined vehicles market from USD 300 billion in 2025 to USD 1070 billion in 2034. The full series behind that rate covers USD 95 billion in 2020, USD 252 billion in 2024, USD 352 billion in 2026 and USD 640 billion in 2030, with 2025 as the base year.
58.5% of 2025 revenue sits in Hardware, worth USD 175.5 billion and rising to USD 481.5 billion at 45% by 2034, the largest offering line in both years. Growth is fastest in Services at 18.5% and slowest in Hardware at 11.56%. The lines gaining share are Services. Hardware lose share without losing revenue.
The vehicle type split puts Passenger Vehicles first, at USD 228 billion and 76% of revenue in 2025, rising to USD 759.7 billion and 71% in 2034. Light Commercial Vehicles grows faster at 17.69% against 14.31%, moving from 14% of revenue to 17% by 2034. It cuts the same total as the offering axis from a different commercial angle, so revenue does not add across the two.
Geographically, 38% of 2025 revenue sits in Asia Pacific (USD 114 billion rising to USD 478.83 billion) ahead of North America at 30% and USD 90 billion. Middle East and Africa is smallest, at 3%. Asia Pacific gain share across the period, so growth is not distributed evenly between regions.
Behind these figures sit five regions, two offering lines and ten segmentation axes, each reported for every year from 2020 to 2034. The headline 2025 value is arrived at by triangulating published aggregates against category proxies, not by an independent count, and the same applies to the segment, regional and country breakdowns drawn from it.
Market Size, 2020–2034
USD BillionRevenue in USD Billion. Values up to 2025 are actuals; 2026–2034 are forecast.
Key Takeaways
- The global software defined vehicles market moves from USD 95 billion in 2020 to USD 300 billion in 2025 and USD 1070 billion by 2034, the forecast period compounding at 14.91% a year.
- The largest line by offering is Hardware, worth USD 175.5 billion and 58.5% of revenue in 2025, rising to USD 481.5 billion and 45% by 2034.
- Services is the fastest-growing line at 18.5%, lifting its share from 41.5% in 2025 to 55% in 2034 and its revenue from USD 124.5 billion to USD 588.5 billion.
- Against a base case of USD 1070 billion in 2034, the study also reports a bear case at USD 722 billion and a bull case at USD 1290 billion, with the assumptions behind each set out separately.
- Asia Pacific holds 38% of global revenue in 2025 at USD 114 billion, the largest of the five regions tracked, and reaches USD 478.83 billion by 2034.
- Within Asia Pacific, China is the worked country example, at USD 56 billion in 2025; 49.12% of regional revenue in the base year, and USD 250 billion by 2034.
- Every line on all ten segmentation axes and in each of the five regions carries its own revenue, share and growth rate for all fifteen years, 2020 through 2034, on a 2025 base.
Market Trends
Revenue Share, By offering
Base year 2025Hardware leads with 58.5% of offering segment revenue.
Share of offering segment revenue, most recent base year.
Read across the forecast period, the global software defined vehicles market shows movement in three places: offering composition, regional weight, and the 14.91% rate applied to the whole.
The direction of the market is not in question in any of the three. Each line and each region grows in revenue terms; what separates them is which takes the larger part of the growth.
The offering mix tilts toward Services. The widest spread on the offering axis is between Services at 18.5% and Hardware at 11.56%. Shares follow: 41.5% to 55% for Services, 58.5% to 45% for Hardware. The revenue figures behind that are USD 124.5 billion to USD 588.5 billion and USD 175.5 billion to USD 481.5 billion. Both expand; where a supplier sits on the axis still decides whether it tracks the market.
Asia Pacific gain regional share. Asia Pacific moves from 38% of revenue in 2025 to 44.75% in 2034, worth USD 114 billion rising to USD 478.83 billion. Share moves off the others in turn: North America at 30% moving to 25.5%, Europe at 25% moving to 22.75%, Latin America at 4% moving to 4%, Middle East and Africa at 3% moving to 3%, each still growing in revenue terms. Revenue added in this market is therefore concentrating geographically instead of spreading evenly, and a participant weighted toward a share-losing region grows more slowly than the market even while its own revenue climbs.
The series never breaks trajectory. Year by year the total runs USD 95 billion in 2020, USD 252 billion in 2024, USD 300 billion in 2025, USD 352 billion in 2026, USD 640 billion in 2030 and USD 1070 billion in 2034. Against 25.86% through the historical period, the 14.91% forecast rate is a continuation; no year in the series interrupts it. For a participant that makes planning a question of capturing a share of steady expansion instead of timing a discontinuity, and it is why the offering and regional mixes matter more to a forecast than the headline rate does.
Market Growth Factors
Services adds the most incremental growth
Market Drivers
3- 01Services adds the most incremental growth
18.5% growth in Services, against 14.91% for the market as a whole, moves it from USD 124.5 billion and 41.5% of revenue in 2025 to USD 588.5 billion and 55% in 2034. Nothing else on the axis grows as fast (Hardware manages 11.56%) so the blended 14.91% is carried by this one line instead of shared across them. That makes position on the offering axis a growth decision, not a product one.
- 02The two largest regions hold most of the base
The largest regional base is Asia Pacific: USD 114 billion in 2025 at 38% of the global total, USD 478.83 billion by 2034 and 44.75%. North America adds a further 30% at USD 90 billion, reaching USD 272.85 billion. Most of the base and most of the growth sit in those two, and a plan spread evenly across regions therefore over-invests outside them.
- 03The trend is already in the record
The historical period compounded at 25.86%; USD 95 billion in 2020, USD 252 billion in 2024 and USD 300 billion in 2025. From there the forecast carries 14.91% through to USD 1070 billion in 2034. Because the growth is already in the record and not only in the projection, the rate is held flat across the forecast instead of ramped, and the risk in the number sits in the mix assumptions, not in whether the market grows at all.
Growth drivers
| # | Growth driver | Impact | Gross contribution (USD Billion) | 2026-28 | 2029-31 | 2032-34 |
|---|---|---|---|---|---|---|
| 1 | Shift to zonal and central compute architectures | High | +270 | High | High | Medium |
| 2 | Rising autonomy and driver assistance software content | High | +220 | High | High | High |
| 3 | Recurring software revenue through updates, features on demand and subscriptions | Medium-High | +190 | Medium | High | High |
| 4 | Growth in electric vehicle production | Medium-High | +140 | High | High | Medium |
| 5 | Cybersecurity and software-update regulation | Medium | +90 | Medium | Medium | Low |
| 6 | Others | Low | +50 | Low | Low | Low |
| Total | +960 | |||||
Restraints
| # | Restraint | Impact | Estimated reduction (USD Billion) | 2026-28 | 2029-31 | 2032-34 |
|---|---|---|---|---|---|---|
| 1 | Software integration cost and programme delays at automakers | Medium-High | −80 | High | Medium | Medium |
| 2 | Cybersecurity liability and compliance cost | Medium | −65 | Medium | Medium | Medium |
| 3 | Owner reluctance to pay for features and fragmented regional rules | Medium | −45 | Medium | Low | Low |
| Total | −190 | |||||
Drivers contribute 960 USD Billion and restraints remove 190 USD Billion, a net 770 USD Billion, which is the revenue the market adds between the base year and 2034. Contributions are CDI estimates, apportioned so that they reconcile with the forecast rather than being read from it.
Separate the 14.91% into its parts and three show up: an already-large base compounding, the offering mix moving toward its faster lines, and regional growth landing unevenly.
Restraining Factors
What holds the forecast back
Market Restraints
2- 01What holds the forecast back
A bear case of USD 722 billion in 2034, against USD 1070 billion in the base case, rests on one stated assumption: platform programmes slip, vehicle demand is weaker, integration cost stays high and fewer owners pay for software features. Neither case changes the USD 300 billion 2025 base.
- 02Hardware grows below the market rate
Hardware carries 58.5% of 2025 revenue at USD 175.5 billion but compounds at 11.56% against 14.91% for the market, taking its share to 45% by 2034 even as revenue rises to USD 481.5 billion. Because it carries that much of the base, its pace holds the blended rate down more than any faster line lifts it.
Market Opportunities
Where the forecast could be beaten
Market Opportunities
2- 01Where the forecast could be beaten
Platform launches stay on schedule, zonal and central compute reach volume sooner, and owners accept recurring software fees at higher rates. On that assumption the market reaches USD 1290 billion by 2034 against USD 1070 billion in the base case, from the same USD 300 billion in 2025.
- 02Services share moves from 41.5% to 55%
Share on the offering axis moves toward Services, from 41.5% in 2025 to 55% in 2034, on 18.5% growth against the market's 14.91% and revenue rising from USD 124.5 billion to USD 588.5 billion. Taking position there does not require displacing whoever holds Hardware, which is the harder and more expensive fight.
Market Challenges
One offering line carries the market
Market Challenges
2- 01One offering line carries the market
USD 175.5 billion of 2025 revenue sits in Hardware, 58.5% of the total, and it is still 45% at USD 481.5 billion nine years later. No other single change on the offering axis moves the total as much as a change in demand for that one line.
- 02Single-country exposure in Asia Pacific
Of Asia Pacific's USD 114 billion in 2025, USD 56 billion (49.12%) comes from China alone, rising to USD 250 billion by 2034. Regional totals therefore move largely with one country's demand, so a regional forecast is more exposed to single-country conditions than its size alone suggests.
Segmentation Analysis
10 axesSegmentation runs along ten axes: offering, vehicle type, propulsion, level of autonomy, sdv type, application, electrical/electronic architecture, connectivity, sales channel and software delivery model. Each axis cuts the same total revenue along a different commercial dimension, so the splits are alternative views of one market, not additions to it.
All two offering lines expand in revenue terms over the forecast period. Share is the dividing line; one takes it, the other cedes it.
By Offering · 2 segments
Hardware Led by Offering in 2025, with Services Growing Fastest
- Largest Hardware · 58.5%
- Fastest Services · 18.5%
- Moves most Hardware · -13.5 pts
- Order by 2034 changes
| Segment | 2025 | Share | 2034 | Share | CAGR |
|---|---|---|---|---|---|
| Hardware | $176B | 58.5% | $482B | 45%-13.5 | 11.6% |
| Services | $125B | 41.5% | $589B | 55%+13.5 | 18.5% |
Hardware leads because every vehicle needs compute modules, sensors, gateways and networking before any software can run, and automakers buy those parts at scale on long programmes. Services grow fastest as integration work, over-the-air delivery, data handling and paid feature activation turn a one-time hardware sale into a continuing revenue stream across the life of the vehicle. Leadership changes hands: Services is the largest line by 2034, not Hardware. This is the axis the estimation prices in full, year by year, and the one the regional chapters cut against.
By Vehicle Type · 3 segments
Scale in Passenger Vehicles and Growth in Light Commercial Vehicles Define the Vehicle type Axis
- Largest Passenger Vehicles · 76%
- Fastest Light Commercial Vehicles · 17.7%
- Moves most Passenger Vehicles · -5 pts
- Order by 2034 unchanged
| Segment | 2025 | Share | 2034 | Share | CAGR |
|---|---|---|---|---|---|
| Passenger Vehicles | $228B | 76% | $760B | 71%-5 | 14.3% |
| Light Commercial Vehicles | $42B | 14% | $182B | 17%+3 | 17.7% |
| Heavy Commercial Vehicles | $30B | 10% | $128B | 12%+2 | 17.5% |
Passenger vehicles lead because production volumes are far larger and buyers expect connected, updatable features as standard. Commercial vehicles grow fastest from a smaller base, as fleet operators adopt telematics, remote diagnostics and software-based uptime services that cut maintenance cost and improve utilisation across large vehicle pools. By 2034 Passenger Vehicles is still ahead, making this a shift in weight, not a change of leader.
By Propulsion · 4 segments
Internal Combustion Engine Led by Propulsion in 2025, with Fuel Cell Electric Vehicle Growing Fastest
- Largest Internal Combustion Engine · 52%
- Fastest Fuel Cell Electric Vehicle · 24.4%
- Moves most Internal Combustion Engine · -30 pts
- Order by 2034 changes
| Segment | 2025 | Share | 2034 | Share | CAGR |
|---|---|---|---|---|---|
| Internal Combustion Engine | $156B | 52% | $235B | 22%-30 | 4.7% |
| Hybrid Electric Vehicle | $45B | 15% | $182B | 17%+2 | 16.8% |
| Battery Electric Vehicle | $93B | 31% | $610B | 57%+26 | 23.2% |
| Fuel Cell Electric Vehicle | $6B | 2% | $42.80B | 4%+2 | 24.4% |
Internal combustion vehicles still lead in installed volume, so they carry the largest share of current software spending. Fuel cell vehicles grow fastest from a very small base, while battery electric vehicles add the most new revenue because battery management, thermal control and charging depend on software and new electric platforms are designed around centralised compute. By 2034 the largest line is Battery Electric Vehicle and no longer Internal Combustion Engine, the one axis here where the order actually changes.
By Level of Autonomy · 5 segments
Level 2 Held the Dominant Share of the Level of autonomy Segment in 2025
- Largest Level 2 · 52%
- Fastest Level 5 · 34.4%
- Moves most Level 2 · -16 pts
- Order by 2034 changes
| Segment | 2025 | Share | 2034 | Share | CAGR |
|---|---|---|---|---|---|
| Level 1 | $42B | 14% | $64.20B | 6%-8 | 4.8% |
| Level 2 | $156B | 52% | $385B | 36%-16 | 10.6% |
| Level 3 | $72B | 24% | $353B | 33%+9 | 19.3% |
| Level 4 | $27B | 9% | $225B | 21%+12 | 26.6% |
| Level 5 | $3B | 1% | $42.80B | 4%+3 | 34.4% |
Driver assistance at the second level leads because it is now fitted as standard or as a common option across mainstream models. The fully driverless level grows fastest from a very small base, as robotaxi and highway pilot programmes move from trials toward commercial service and need far heavier compute and validation software. The order does not change: Level 2 is still largest in 2034, and what moves is how much it holds.
By Sdv Type · 2 segments
Semi-SDV Held the Dominant Share of the Sdv type Segment in 2025
- Largest Semi-SDV · 82%
- Fastest Fully SDV · 29.6%
- Moves most Semi-SDV · -34 pts
- Order by 2034 changes
| Segment | 2025 | Share | 2034 | Share | CAGR |
|---|---|---|---|---|---|
| Semi-SDV | $246B | 82% | $514B | 48%-34 | 8.5% |
| Fully SDV | $54B | 18% | $556B | 52%+34 | 29.6% |
Semi-software-defined vehicles lead because most vehicles on the road are still upgraded from existing architectures, adding over-the-air updates and some centralised control without a full redesign. Fully software-defined vehicles grow fastest as new platforms launch with centralised compute, a single operating layer and hardware designed for feature changes long after delivery. Leadership changes hands: Fully SDV is the largest line by 2034, not Semi-SDV.
By Application · 6 segments
Scale in Autonomous Driving and ADAS and Growth in Vehicle Security and Safety Define the Application Axis
- Largest Autonomous Driving and ADAS · 28%
- Fastest Vehicle Security and Safety · 22.2%
- Moves most Infotainment and Cockpit · -7 pts
- Order by 2034 changes
| Segment | 2025 | Share | 2034 | Share | CAGR |
|---|---|---|---|---|---|
| Autonomous Driving and ADAS | $84B | 28% | $353B | 33%+5 | 17.3% |
| Connected Services and Telematics | $54B | 18% | $193B | 18% | 15.2% |
| Infotainment and Cockpit | $66B | 22% | $161B | 15%-7 | 10.4% |
| Powertrain and Chassis Control | $42B | 14% | $118B | 11%-3 | 12.1% |
| Body and Comfort Electronics | $24B | 8% | $64.20B | 6%-2 | 11.6% |
| Vehicle Security and Safety | $30B | 10% | $182B | 17%+7 | 22.2% |
Autonomous driving and ADAS leads because it needs the most compute, sensor fusion and validation software per vehicle. Vehicle security and safety grows fastest as cybersecurity and software-update rules oblige automakers to protect and monitor connected systems for the whole vehicle life, which turns it into a requirement on every new platform. Autonomous Driving and ADAS remains the largest line through 2034, so the axis changes in proportion, not in order.
By Electrical/electronic Architecture · 4 segments
Central Compute Architecture Outpaces the Axis While Distributed Architecture Holds the Largest Share
- Largest Distributed Architecture · 40%
- Fastest Central Compute Architecture · 39.5%
- Moves most Distributed Architecture · -32 pts
- Order by 2034 changes
| Segment | 2025 | Share | 2034 | Share | CAGR |
|---|---|---|---|---|---|
| Distributed Architecture | $120B | 40% | $85.60B | 8%-32 | -3.7% |
| Domain-Centralized Architecture | $114B | 38% | $300B | 28%-10 | 11.3% |
| Zonal Architecture | $51B | 17% | $385B | 36%+19 | 25.2% |
| Central Compute Architecture | $15B | 5% | $300B | 28%+23 | 39.5% |
Distributed architectures lead today because most vehicles in production still use many separate electronic control units with dedicated software. Central compute grows fastest from a very small base as automakers consolidate dozens of controllers into a few high-performance computers, cutting wiring weight and allowing new features to be released through software alone. Leadership changes hands: Zonal Architecture is the largest line by 2034, not Distributed Architecture.
By Connectivity · 5 segments
Scale in Cellular and Growth in Satellite Define the Connectivity Axis
- Largest Cellular · 38%
- Fastest Satellite · 30.1%
- Moves most Ethernet In-Vehicle Network · +6 pts
- Order by 2034 changes
| Segment | 2025 | Share | 2034 | Share | CAGR |
|---|---|---|---|---|---|
| Cellular | $114B | 38% | $385B | 36%-2 | 14.5% |
| Wi-Fi | $36B | 12% | $85.60B | 8%-4 | 10.1% |
| Bluetooth | $30B | 10% | $64.20B | 6%-4 | 8.8% |
| Satellite | $6B | 2% | $64.20B | 6%+4 | 30.1% |
| Ethernet In-Vehicle Network | $114B | 38% | $471B | 44%+6 | 17.1% |
Cellular and in-vehicle Ethernet are the largest lines because cellular links carry updates, telematics and cloud services, and Ethernet carries the high-bandwidth traffic between computers, cameras and displays. Satellite grows fastest from a very small base as coverage for remote regions and emergency services starts to appear in production vehicles. By 2034 the largest line is Ethernet In-Vehicle Network and no longer Cellular, the one axis here where the order actually changes.
By Sales Channel · 2 segments
OEM-Integrated Both Leads the Sales channel Axis and Grows Fastest on It
- Largest OEM-Integrated · 93%
- Fastest OEM-Integrated · 15.4%
- Moves most OEM-Integrated · +2 pts
- Order by 2034 unchanged
| Segment | 2025 | Share | 2034 | Share | CAGR |
|---|---|---|---|---|---|
| OEM-Integrated | $279B | 93% | $1017B | 95%+2 | 15.4% |
| Aftermarket | $21B | 7% | $53.50B | 5%-2 | 10.9% |
OEM-integrated software both leads and grows fastest because features are designed, validated and installed at the factory, and safety and cybersecurity rules tie them to the original vehicle. The aftermarket is smaller and expands more slowly, held back by limited access to vehicle networks and warranty concerns, though retrofit telematics and diagnostics give it a steady base. OEM-Integrated remains the largest line through 2034, so the axis changes in proportion, not in order.
By Software Delivery Model · 4 segments
Scale in Embedded Perpetual Software and Growth in Subscription Services Define the Software delivery model Axis
- Largest Embedded Perpetual Software · 40%
- Fastest Subscription Services · 22.6%
- Moves most Embedded Perpetual Software · -20 pts
- Order by 2034 changes
| Segment | 2025 | Share | 2034 | Share | CAGR |
|---|---|---|---|---|---|
| Over-the-Air Updates | $90B | 30% | $321B | 30% | 15.2% |
| Features on Demand | $42B | 14% | $235B | 22%+8 | 21.1% |
| Subscription Services | $48B | 16% | $300B | 28%+12 | 22.6% |
| Embedded Perpetual Software | $120B | 40% | $214B | 20%-20 | 6.6% |
Embedded perpetual software leads for now because most vehicles are still sold with features fixed at purchase. Subscription services grow fastest as automakers move toward recurring revenue, offering driver assistance, connectivity and comfort functions that owners can switch on, pause or renew over the life of the car, with features on demand close behind. Leadership changes hands: Over-the-Air Updates is the largest line by 2034, not Embedded Perpetual Software.
Regional Insights
Regional Revenue Share
Base year 2025Share of global revenue in the base year.
Only the leading region's share is published outside the report; pins mark the region, not a specific country.
North America Market Analysis
The 2nd-largest region covered — 4.5 points of share move elsewhere by 2034, while revenue still grows 3.0×.
- Rank 2 of 5
- 2025 share 30%
- By 2034 25.5%
- Revenue $90B → $273B
North America holds 30% of the global software defined vehicles market in 2025, worth USD 90 billion on the way to USD 272.85 billion by 2034. That makes it the second-largest region covered, in 2025 and again in 2034.
25.5% of global revenue sits here in 2034, below the 2025 level, and the region keeps growing in absolute terms while others expand faster, a change in relative weight, not a decline in demand.
Within the region the offering split tracks the global one; 58.5% of 2025 revenue in Hardware, fastest growth of 18.5% in Services. The full report breaks North America out along every axis and by country.
United States
Sets the pace for North America at 82.2% of it, growing 3.0×.
- In region 1 of 2
- Of region 82.2%
- Of global 24.7%
- Revenue $74B → $220B
The United States is the largest market within North America, generating USD 74 billion in 2025 and projected to reach USD 220 billion by 2034. Carrying 82.22% of the region in the base year, it sets North America's direction instead of merely contributing to it. Regional revenue of USD 90 billion in 2025 and USD 272.85 billion in 2034 sits around it, and it is the country used wherever the full report cuts a figure by geography.
the United States buys along the same lines as the market globally; Hardware first at 58.5% of 2025 revenue and 45% in 2034, Services fastest at 18.5% on a share moving from 41.5% to 55%. Its 82.22% weight in North America means those movements carry straight into the regional totals. Per-offering revenue for the United States appears on its own in the full report.
Software defined vehicles in the United States fall under the National Highway Traffic Safety Administration, which administers the Federal Motor Vehicle Safety Standards through a self-certification model: the manufacturer declares conformity, and the agency investigates and orders recalls where a defect creates a safety risk. Over-the-air updates that change safety-relevant behaviour are treated as potential recall events and must be reported. Emissions and software-based emission controls sit with the Environmental Protection Agency and the California Air Resources Board. Cybersecurity expectations follow agency guidance and the international automotive cybersecurity engineering standard, and suppliers are asked to document their secure development process. Driver-assistance features draw additional scrutiny through reporting orders.
Competition in the United States runs between the suppliers this study tracks: Robert Bosch GmbH, NVIDIA Corporation, Qualcomm Incorporated, Continental AG, Aptiv PLC, Mobileye Global Inc., HARMAN International, BlackBerry Limited, Valeo SA, Marelli Holdings Co., Ltd., ZF Friedrichshafen AG, Tesla, Inc., Volkswagen Group (CARIAD SE), Mercedes-Benz Group AG, BMW AG, Toyota Motor Corporation (Woven by Toyota), Hyundai Motor Company (42dot), Denso Corporation, Infineon Technologies AG, NXP Semiconductors N.V., Renesas Electronics Corporation, Wind River Systems, Inc., Elektrobit Automotive GmbH, Luxoft (DXC Technology), Vector Informatik GmbH, Magna International Inc., Visteon Corporation, Rivian Automotive, Inc., NIO Inc. and XPeng Inc.. Hardware, at 58.5% of 2025 revenue, is where the volume sits, and Services, growing at 18.5%, is where position changes hands over the forecast period. Country-level shares and positioning per company sit in the full report.
Canada
2nd-largest in North America, growing 3.0×.
- In region 2 of 2
- Of region 8.9%
- Of global 2.7%
- Revenue $8B → $24B
Within North America, Canada accounts for 8.89% of regional revenue and 2.67% of the global total, worth USD 8 billion in 2025 and USD 24 billion by 2034.
Europe Market Analysis
The 3rd-largest region covered — 2.2 points of share move elsewhere by 2034, while revenue still grows 3.2×.
- Rank 3 of 5
- 2025 share 25%
- By 2034 22.8%
- Revenue $75B → $243B
Europe holds 25% of the global software defined vehicles market in 2025, worth USD 75 billion on the way to USD 243.43 billion by 2034. That makes it the third-largest region covered, in 2025 and again in 2034.
Its share moves to 22.75% by 2034, though revenue still rises throughout; the shift is in the region's weight against faster-growing ones, which is not the same as weakening demand.
The offering mix reported at global level applies here, with Hardware the largest line at 58.5% of 2025 revenue and Services the fastest-growing at 18.5%. Revenue for Europe is broken out by every segmentation axis and by country in the full report.
Germany
The largest market in Europe, growing 3.0×.
- In region 1 of 3
- Of region 32%
- Of global 8%
- Revenue $24B → $72B
Germany is the largest market within Europe, generating USD 24 billion in 2025 and projected to reach USD 72 billion by 2034. Its 32% of base-year regional revenue leads the region, though enough sits elsewhere that Europe is not a proxy for it. Against regional totals of USD 75 billion in 2025 and USD 243.43 billion in 2034, it is the country the full report breaks out in detail.
Composition here matches the global split: the largest line is Hardware at 58.5% of 2025 revenue, easing to 45% by 2034, and the fastest is Services at 18.5%, from 41.5% to 55%. Since 32% of Europe's revenue is generated here, the regional numbers inherit this market's mix instead of smoothing it out. Revenue by offering for Germany is reported separately in the full report.
Germany applies the European Union type-approval framework, with the Kraftfahrt-Bundesamt acting as the national approval authority. Vehicles must obtain approval under the general vehicle type-approval regulation, which now carries dedicated United Nations rules on cybersecurity management systems and on software update management; a manufacturer needs an audited process certificate before approval is granted. Suppliers must show conformity with the international functional safety standard for road vehicles and with general product safety rules. The General Data Protection Regulation governs personal data generated by connected functions, and the Data Act adds access obligations for vehicle-generated data. Automated driving functions follow national legislation on autonomous operation.
The suppliers tracked in this study (Robert Bosch GmbH, NVIDIA Corporation, Qualcomm Incorporated, Continental AG, Aptiv PLC, Mobileye Global Inc., HARMAN International, BlackBerry Limited, Valeo SA, Marelli Holdings Co., Ltd., ZF Friedrichshafen AG, Tesla, Inc., Volkswagen Group (CARIAD SE), Mercedes-Benz Group AG, BMW AG, Toyota Motor Corporation (Woven by Toyota), Hyundai Motor Company (42dot), Denso Corporation, Infineon Technologies AG, NXP Semiconductors N.V., Renesas Electronics Corporation, Wind River Systems, Inc., Elektrobit Automotive GmbH, Luxoft (DXC Technology), Vector Informatik GmbH, Magna International Inc., Visteon Corporation, Rivian Automotive, Inc., NIO Inc. and XPeng Inc.) compete in Germany across the offering lines above. Hardware, at 58.5% of 2025 revenue, is where the volume sits, and Services, growing at 18.5%, is where position changes hands over the forecast period. A supplier weighted toward Europe is competing over a base of USD 75 billion in 2025 reaching USD 243.43 billion by 2034, 25% of global revenue at the start of that period.
United Kingdom
2nd-largest in Europe, growing 3.0×.
- In region 2 of 3
- Of region 16%
- Of global 4%
- Revenue $12B → $36B
The United Kingdom is sized at USD 12 billion in 2025, rising to USD 36 billion by 2034; 4% of global revenue and 16% of Europe. It is reported separately from Germany across every segmentation axis in the full report.
France
3rd-largest in Europe, growing 3.0×.
- In region 3 of 3
- Of region 12%
- Of global 3%
- Revenue $9B → $27B
France is sized at USD 9 billion in 2025, rising to USD 27 billion by 2034; 3% of global revenue and 12% of Europe. It is reported separately from Germany across every segmentation axis in the full report.
Asia Pacific Market Analysis
The largest region covered, and the one gaining the most — it picks up 6.8 points of share by 2034, while revenue still grows 4.2×.
- Rank 1 of 5
- 2025 share 38%
- By 2034 44.8%
- Revenue $114B → $479B
Asia Pacific holds 38% of the global software defined vehicles market in 2025, worth USD 114 billion on the way to USD 478.83 billion by 2034. It is a dominant region on this axis, first by revenue throughout the period.
Share climbs to 44.75% by 2034, because it outgrows the market's 14.91%; the revenue added here is disproportionate to where the region started.
Segment composition follows the global pattern: Hardware largest at 58.5% of 2025 revenue, Services fastest at 18.5%. Revenue for Asia Pacific is broken out by every segmentation axis and by country in the full report.
China
The largest market in Asia Pacific, growing 4.5×.
- In region 1 of 3
- Of region 49.1%
- Of global 18.7%
- Revenue $56B → $250B
The largest single market in Asia Pacific is China, at USD 56 billion in 2025 and USD 250 billion in 2034. It accounts for 49.12% of regional revenue in the base year, the largest single share without dominating the region outright. Regional revenue of USD 114 billion in 2025 and USD 478.83 billion in 2034 sits around it, and it is the country used wherever the full report cuts a figure by geography.
Composition here matches the global split: the largest line is Hardware at 58.5% of 2025 revenue, easing to 45% by 2034, and the fastest is Services at 18.5%, from 41.5% to 55%. Because the country carries 49.12% of Asia Pacific, a movement in its own mix shows up in the regional totals instead of being averaged away by neighbouring markets. The full report reports China by offering separately.
China regulates software defined vehicles mainly through the Ministry of Industry and Information Technology, together with the State Administration for Market Regulation and the Cyberspace Administration of China. Vehicle products are subject to the China Compulsory Certification scheme and to ministry catalogue announcements, while recent rules require filing and approval of over-the-air software updates before they reach vehicles. Connected-vehicle data security is governed by the Data Security Law, the Personal Information Protection Law and sector-specific automotive data rules, which restrict cross-border transfer and require local storage of important data. Mandatory national standards cover cybersecurity, driver-assistance performance and electromagnetic compatibility, and testing is done by designated domestic laboratories.
Competition in China runs between the suppliers this study tracks: Robert Bosch GmbH, NVIDIA Corporation, Qualcomm Incorporated, Continental AG, Aptiv PLC, Mobileye Global Inc., HARMAN International, BlackBerry Limited, Valeo SA, Marelli Holdings Co., Ltd., ZF Friedrichshafen AG, Tesla, Inc., Volkswagen Group (CARIAD SE), Mercedes-Benz Group AG, BMW AG, Toyota Motor Corporation (Woven by Toyota), Hyundai Motor Company (42dot), Denso Corporation, Infineon Technologies AG, NXP Semiconductors N.V., Renesas Electronics Corporation, Wind River Systems, Inc., Elektrobit Automotive GmbH, Luxoft (DXC Technology), Vector Informatik GmbH, Magna International Inc., Visteon Corporation, Rivian Automotive, Inc., NIO Inc. and XPeng Inc.. Volume sits in Hardware at 58.5% of 2025 revenue; movement sits in Services at 18.5% growth. The commercial size of that position is USD 114 billion in 2025, moving to USD 478.83 billion by 2034 across the forecast period.
Japan
2nd-largest in Asia Pacific, growing 3.4×.
- In region 2 of 3
- Of region 15.8%
- Of global 6%
- Revenue $18B → $62B
Japan is sized at USD 18 billion in 2025, rising to USD 62 billion by 2034; 6% of global revenue and 15.79% of Asia Pacific. It is reported separately from China across every segmentation axis in the full report.
South Korea
3rd-largest in Asia Pacific, growing 3.6×.
- In region 3 of 3
- Of region 7.9%
- Of global 3%
- Revenue $9B → $32B
South Korea is sized at USD 9 billion in 2025, rising to USD 32 billion by 2034; 3% of global revenue and 7.89% of Asia Pacific. It is reported separately from China across every segmentation axis in the full report.
Latin America Market Analysis
The 4th-largest region covered, holding its share flat through 2034, while revenue still grows 3.6×.
- Rank 4 of 5
- 2025 share 4%
- By 2034 4%
- Revenue $12B → $42.80B
Latin America holds 4% of the global software defined vehicles market in 2025, worth USD 12 billion rising to USD 42.8 billion in 2034. By revenue it sits fourth across the study, and the ranking does not change between 2025 and 2034.
Share settles at 4% in 2034, a shift in share, not in direction: revenue climbs every year while the market's centre of gravity moves elsewhere.
Segment composition follows the global pattern: Hardware largest at 58.5% of 2025 revenue, Services fastest at 18.5%. Latin America is reported axis by axis and country by country in the full study.
Brazil
The largest market in Latin America, growing 3.7×.
- In region 1 of 2
- Of region 50%
- Of global 2%
- Revenue $6B → $22B
50% of Latin America's base-year revenue comes from Brazil; USD 6 billion, rising to USD 22 billion by 2034. Its 50% of base-year regional revenue leads the region, though enough sits elsewhere that Latin America is not a proxy for it. Against regional totals of USD 12 billion in 2025 and USD 42.8 billion in 2034, it is the country the full report breaks out in detail.
Composition here matches the global split: the largest line is Hardware at 58.5% of 2025 revenue, easing to 45% by 2034, and the fastest is Services at 18.5%, from 41.5% to 55%. Because the country carries 50% of Latin America, a movement in its own mix shows up in the regional totals instead of being averaged away by neighbouring markets. Per-offering revenue for Brazil appears on its own in the full report.
In Brazil, vehicle homologation is led by the National Traffic Department (Senatran) and its Contran council, with technical conformity assessed through accredited bodies under the national metrology institute, Inmetro. Emissions are overseen by the environmental agency Ibama through the national vehicle emissions control programme. Suppliers of connected electronics must also obtain Anatel certification for any radio communication module. Personal data collected by connected vehicles falls under the Lei Geral de Proteção de Dados, which sets consent, purpose and security duties. Brazil has no dedicated software update approval regime comparable to the European one, so suppliers usually align with United Nations rules where their customers export.
The suppliers tracked in this study (Robert Bosch GmbH, NVIDIA Corporation, Qualcomm Incorporated, Continental AG, Aptiv PLC, Mobileye Global Inc., HARMAN International, BlackBerry Limited, Valeo SA, Marelli Holdings Co., Ltd., ZF Friedrichshafen AG, Tesla, Inc., Volkswagen Group (CARIAD SE), Mercedes-Benz Group AG, BMW AG, Toyota Motor Corporation (Woven by Toyota), Hyundai Motor Company (42dot), Denso Corporation, Infineon Technologies AG, NXP Semiconductors N.V., Renesas Electronics Corporation, Wind River Systems, Inc., Elektrobit Automotive GmbH, Luxoft (DXC Technology), Vector Informatik GmbH, Magna International Inc., Visteon Corporation, Rivian Automotive, Inc., NIO Inc. and XPeng Inc.) compete in Brazil across the offering lines above. Hardware, at 58.5% of 2025 revenue, is where the volume sits, and Services, growing at 18.5%, is where position changes hands over the forecast period. A supplier weighted toward Latin America is competing over a base of USD 12 billion in 2025, reaching USD 42.8 billion by 2034 on the trajectory this study models.
Argentina
2nd-largest in Latin America, growing 3.7×.
- In region 2 of 2
- Of region 12.5%
- Of global 0.5%
- Revenue $1.50B → $5.50B
Argentina is sized at USD 1.5 billion in 2025, rising to USD 5.5 billion by 2034; 0.5% of global revenue and 12.5% of Latin America. It is reported separately from Brazil across every segmentation axis in the full report.
Middle East and Africa Market Analysis
The 5th-largest region covered, holding its share flat through 2034, while revenue still grows 3.6×.
- Rank 5 of 5
- 2025 share 3%
- By 2034 3%
- Revenue $9B → $32.10B
3% of the global software defined vehicles market sits in Middle East and Africa in 2025, worth USD 9 billion rising to USD 32.1 billion in 2034. Among the five regions it ranks fifth by revenue in both years.
By 2034 the share stands at 3%, though revenue still rises throughout; the shift is in the region's weight against faster-growing ones, which is not the same as weakening demand.
Segment composition follows the global pattern: Hardware largest at 58.5% of 2025 revenue, Services fastest at 18.5%. Revenue for Middle East and Africa is broken out by every segmentation axis and by country in the full report.
Saudi Arabia
The largest market in Middle East and Africa, growing 3.8×.
- In region 1 of 3
- Of region 26.7%
- Of global 0.8%
- Revenue $2.40B → $9B
USD 2.4 billion of Middle East and Africa's 2025 revenue is generated in Saudi Arabia, the region's largest market, reaching USD 9 billion by 2034. Its 26.67% of base-year regional revenue leads the region, though enough sits elsewhere that Middle East and Africa is not a proxy for it. Regional revenue of USD 9 billion in 2025 and USD 32.1 billion in 2034 sits around it, and it is the country used wherever the full report cuts a figure by geography.
Demand in Saudi Arabia follows the offering mix reported at global level: Hardware is the largest line at 58.5% of 2025 revenue, moving to 45% by 2034, while Services grows fastest at 18.5% and takes its share from 41.5% to 55%. Because the country carries 26.67% of Middle East and Africa, a movement in its own mix shows up in the regional totals instead of being averaged away by neighbouring markets. Revenue by offering for Saudi Arabia is reported separately in the full report.
Saudi Arabia governs vehicles through the Saudi Standards, Metrology and Quality Organization, which administers technical regulations and conformity assessment under the Gulf Cooperation Council scheme. Imported vehicles and components must carry a certificate of conformity issued through the Saber platform, and the Gulf technical regulation for motor vehicles references United Nations rules for safety. Telecommunication modules need type approval from the Communications, Space and Technology Commission. The Saudi Data and Artificial Intelligence Authority oversees personal data handling under the Personal Data Protection Law, and the National Cybersecurity Authority issues controls that apply to connected systems. Suppliers generally work through an authorised local representative for registration and approvals.
Robert Bosch GmbH, NVIDIA Corporation, Qualcomm Incorporated, Continental AG, Aptiv PLC, Mobileye Global Inc., HARMAN International, BlackBerry Limited, Valeo SA, Marelli Holdings Co., Ltd., ZF Friedrichshafen AG, Tesla, Inc., Volkswagen Group (CARIAD SE), Mercedes-Benz Group AG, BMW AG, Toyota Motor Corporation (Woven by Toyota), Hyundai Motor Company (42dot), Denso Corporation, Infineon Technologies AG, NXP Semiconductors N.V., Renesas Electronics Corporation, Wind River Systems, Inc., Elektrobit Automotive GmbH, Luxoft (DXC Technology), Vector Informatik GmbH, Magna International Inc., Visteon Corporation, Rivian Automotive, Inc., NIO Inc. and XPeng Inc. are the suppliers covered in Saudi Arabia. Two different problems sit on the same axis: holding Hardware at 58.5% of 2025 revenue, and taking Services while it grows at 18.5%. A supplier weighted toward Middle East and Africa is competing over a base of USD 9 billion in 2025 reaching USD 32.1 billion by 2034, 3% of global revenue at the start of that period.
United Arab Emirates
2nd-largest in Middle East and Africa, growing 3.8×.
- In region 2 of 3
- Of region 24.4%
- Of global 0.7%
- Revenue $2.20B → $8.40B
Within Middle East and Africa, the United Arab Emirates accounts for 24.44% of regional revenue and 0.73% of the global total, worth USD 2.2 billion in 2025 and USD 8.4 billion by 2034.
South Africa
3rd-largest in Middle East and Africa, growing 3.0×.
- In region 3 of 3
- Of region 15.6%
- Of global 0.5%
- Revenue $1.40B → $4.20B
South Africa is sized at USD 1.4 billion in 2025, rising to USD 4.2 billion by 2034; 0.47% of global revenue and 15.56% of Middle East and Africa. It is reported separately from Saudi Arabia across every segmentation axis in the full report.
Download a free sample to see the full data tables and segment-level detail behind this analysis.
Report Coverage
This report assesses the market across every segment, with revenue and a growth rate for each line in each year of the study period. It covers the drivers, trends, opportunities, restraints and challenges shaping growth, the competitive landscape and the companies profiled, and the research methodology behind every estimate. Segmentation is reported by offering, vehicle type, propulsion, level of autonomy, sdv type, application, electrical/electronic architecture, connectivity, sales channel, software delivery model, and regional analysis covers North America, Europe, Asia Pacific, Latin America, Middle East and Africa, each broken out by country.
Competitive Landscape
Suppliers Compete on Hardware Volume and Services Momentum
Suppliers in scope: Robert Bosch GmbH, NVIDIA Corporation, Qualcomm Incorporated, Continental AG, Aptiv PLC, Mobileye Global Inc., HARMAN International, BlackBerry Limited, Valeo SA, Marelli Holdings Co., Ltd., ZF Friedrichshafen AG, Tesla, Inc., Volkswagen Group (CARIAD SE), Mercedes-Benz Group AG, BMW AG, Toyota Motor Corporation (Woven by Toyota), Hyundai Motor Company (42dot), Denso Corporation, Infineon Technologies AG, NXP Semiconductors N.V., Renesas Electronics Corporation, Wind River Systems, Inc., Elektrobit Automotive GmbH, Luxoft (DXC Technology), Vector Informatik GmbH, Magna International Inc., Visteon Corporation, Rivian Automotive, Inc., NIO Inc. and XPeng Inc..
Competition follows the offering split, not the regional one. Hardware is 58.5% of 2025 revenue at USD 175.5 billion and still 45% in 2034, so it is where the volume sits and where an incumbent's position is hardest to move. The line that changes hands is Services at 18.5%, well ahead of Hardware at 11.56%. The two rarely sit with the same supplier, and that is the reason a USD 300 billion market is not already consolidated.
Suppliers separate on who controls the vehicle's central compute and software stack. Large semiconductor and tier-one firms hold advantages in silicon roadmaps, functional-safety certification, validated reference platforms and long programme relationships with automakers that last a full vehicle cycle. Automakers building their own operating systems compete on data access, release cadence and ownership of the customer account. Specialist software houses compete on middleware, tooling and integration speed, while regional suppliers win on local content requirements and cost. Over-the-air update capability, cybersecurity certification and the ability to maintain software for many years now weigh heavily in awards.
The regional picture sets the entry cost: 38% of revenue is in Asia Pacific and 30% in North America, so a credible global position requires both, while Middle East and Africa at 3% can be served opportunistically.
Per-company profiles, financials, share and development history are in the full report and not here.
List of Key Software Defined Vehicles Market Companies Profiled
30 companies profiled. Company profiles, including financials, product portfolios and recent developments, are part of the full report.
- Robert Bosch GmbH(Germany)
- NVIDIA Corporation(United States)
- Qualcomm Incorporated(United States)
- Continental AG(Germany)
- Aptiv PLC(Jersey)
- Mobileye Global Inc.(Israel)
- HARMAN International(United States)
- BlackBerry Limited(Canada)
- Valeo SA(France)
- Marelli Holdings Co., Ltd.(Japan)
- ZF Friedrichshafen AG(Germany)
- Tesla, Inc.(United States)
- Volkswagen Group (CARIAD SE)(Germany)
- Mercedes-Benz Group AG(Germany)
- BMW AG(Germany)
- Toyota Motor Corporation (Woven by Toyota)(Japan)
- Hyundai Motor Company (42dot)(South Korea)
- Denso Corporation(Japan)
- Infineon Technologies AG(Germany)
- NXP Semiconductors N.V.(Netherlands)
- Renesas Electronics Corporation(Japan)
- Wind River Systems, Inc.(United States)
- Elektrobit Automotive GmbH(Germany)
- Luxoft (DXC Technology)(United States)
- Vector Informatik GmbH(Germany)
- Magna International Inc.(Canada)
- Visteon Corporation(United States)
- Rivian Automotive, Inc.(United States)
- NIO Inc.(China)
- XPeng Inc.(China)
Geographic Coverage
Every market below is broken out separately in the report.
North America
3Europe
8Asia Pacific
12Latin America
3Middle East and Africa
4Key Insights
Report Scope
Study parameters & segmentationThis study covers market size and forecasts over the 2020–2034 period, segmentation across 10 axes (Offering, Vehicle Type, Propulsion, Level of Autonomy, Sdv Type, Application, Electrical/electronic Architecture, Connectivity, Sales Channel, Software Delivery Model), regional analysis for 5 regions and their constituent countries, a competitive landscape profiling 30 key companies, and the research methodology behind every estimate.
Segmentation
10 axes + regionQuestions This Report Answers
6 questionsWhat is the market size and growth rate, globally and by region?
How is the market segmented, and which segments lead?
Which regions and countries are covered, and how do they compare?
What are the key drivers, restraints, opportunities and challenges?
Who are the leading companies operating in this market?
What trends are expected to shape the market through the forecast period?
Frequently Asked Questions
01What is the Software Defined Vehicles Market projected to reach?
USD 1070 USD Billion by 2034, CAGR 14.91%
02What years does this report cover?
Study period 2020–2034, base year 2025, historical data 2020-2024, forecast period 2026-2034.
03Which regions are covered?
North America, Europe, Asia Pacific, Latin America, Middle East and Africa.
04Which region accounted for the largest market share?
Asia Pacific leads with 38% of global revenue through 2034.
05Which segment leads the market?
Hardware is the largest line by offering, at 58.5% of revenue in 2025.
06Who are the key companies profiled?
Robert Bosch GmbH, NVIDIA Corporation, Qualcomm Incorporated, Continental AG, Aptiv PLC, Mobileye Global Inc., HARMAN International, BlackBerry Limited, Valeo SA, Marelli Holdings Co., Ltd., ZF Friedrichshafen AG, Tesla, Inc., Volkswagen Group (CARIAD SE), Mercedes-Benz Group AG, BMW AG, Toyota Motor Corporation (Woven by Toyota), Hyundai Motor Company (42dot), Denso Corporation, Infineon Technologies AG, NXP Semiconductors N.V., Renesas Electronics Corporation, Wind River Systems, Inc., Elektrobit Automotive GmbH, Luxoft (DXC Technology), Vector Informatik GmbH, Magna International Inc., Visteon Corporation, Rivian Automotive, Inc., NIO Inc., XPeng Inc.. Full profiles are part of the paid report.
07Can the segmentation be customized?
Yes. Custom data cuts by geography, segment, or competitor set are available on request.
Why choose CDI
Need this report shaped around your question?
The scope isn't fixed. Tell us what your team needs that the standard edition doesn't cover, and an analyst will come back on what can be adjusted and how long it takes, before you commit to anything.
Most licences include 30–60 hours of customization at no extra cost. See what each licence includes
Additional Companies
Add competitors, suppliers or the peer set you benchmark against to the companies already covered.
Deeper Competitive View
Sharpen the landscape work around your own position: product line, channel, or a named shortlist of rivals.
Extra Segment Splits
Break the market down along an axis the standard scope doesn't cut it by, or go a level deeper inside one.
Application Focus
Narrow the analysis to the specific use cases and end users your team actually sells into.
Different Time Frame
Move the base year, or widen the historical and forecast windows the study is built on.
Country-Level Detail
Go below region level into the individual countries that matter to you, rather than the standard geography split.