
RNA Editing MarketSize, Share & Industry Analysis, 2026-2034By TechnologyBy Edit TypeBy Delivery MethodBy OfferingBy Therapeutic AreaBy Target MechanismBy Development StageBy Route of AdministrationBy ApplicationBy End User
Full title & scope — all 10 axes with their segments
RNA Editing Market Size, Share & Industry Analysis, By Technology (ADAR-based RNA Editing, CRISPR-based RNA Editing, APOBEC-based RNA Editing, RNA Exon Editing, Chemical and Synthetic Editing Platforms, Epitranscriptomic Editing), By Edit Type (Adenosine-to-Inosine, Cytidine-to-Uridine, Exon Replacement, RNA Base Modification, Splicing Modulation), By Delivery Method (Lipid Nanoparticles, Adeno-Associated Virus Vectors, GalNAc Conjugates, Lentiviral Vectors, Electroporation, Other Non-viral Methods), By Offering (Therapeutic Candidates and Programs, Reagents and Kits, Instruments and Platforms, Software and Bioinformatics, Services), By Therapeutic Area (Rare Genetic Disorders, Neurological Disorders, Oncology, Ophthalmic Disorders, Cardiovascular and Metabolic Disorders, Infectious Diseases, Liver Diseases), By Target Mechanism (Correction of Pathogenic Point Mutations, Protein Upregulation, Protein Modulation, Start Codon and Stop Codon Editing, Post-translational Modification Site Editing, Splice Site Editing), By Development Stage (Discovery and Research, Preclinical, Phase I, Phase II, Phase III and Beyond), By Route of Administration (Intravenous, Subcutaneous, Intrathecal, Intravitreal, Intramuscular, Intracerebroventricular), By Application (Therapeutics Development, Drug Discovery and Target Validation, Basic and Translational Research, Diagnostics and Biomarker Development, Agricultural and Industrial Biotechnology), By End User (Biotechnology Companies, Pharmaceutical Companies, Academic and Research Institutes, Contract Research and Manufacturing Organizations, Hospitals and Specialty Clinics), and Regional Forecast, 2026-2034
Market outlook, key takeaways, drivers and challenges for the report period.
- 01By TechnologyADAR-based RNA Editing · CRISPR-based RNA Editing · APOBEC-based RNA Editing
- 02By Edit TypeAdenosine-to-Inosine · Cytidine-to-Uridine · Exon Replacement
- 03By Delivery MethodLipid Nanoparticles · Adeno-Associated Virus Vectors · GalNAc Conjugates
- 04By OfferingTherapeutic Candidates and Programs · Reagents and Kits · Instruments and Platforms
- 05By Therapeutic AreaRare Genetic Disorders · Neurological Disorders · Oncology
- 06By Target MechanismCorrection of Pathogenic Point Mutations · Protein Upregulation · Protein Modulation
- 07By Development StageDiscovery and Research · Preclinical · Phase I
- 08By Route of AdministrationIntravenous · Subcutaneous · Intrathecal
- 09By ApplicationTherapeutics Development · Drug Discovery and Target Validation · Basic and Translational Research
- 10By End UserBiotechnology Companies · Pharmaceutical Companies · Academic and Research Institutes
- 11By Region
Market Analysis & Outlook
RNA editing changes the sequence or chemical state of messenger RNA inside a cell without altering the underlying DNA, using natural enzymes, programmable guide molecules or synthetic oligonucleotides. The category covers therapeutic programs together with the reagents, kits, instruments, software and services used to discover and develop them, across base conversion, exon replacement and base modification. Buyers include biotechnology and pharmaceutical developers, academic and research institutes, contract research and manufacturing organizations, and specialty clinics running trials.
USD 1.9 billion of revenue was recorded in the global rna editing market in 2025. By 2034 the figure reaches USD 9.25 billion, a compound annual growth rate of 19% through the forecast period, along a series that runs USD 0.7 billion in 2020, USD 1.56 billion in 2024, USD 2.3 billion in 2026 and USD 4.68 billion in 2030.
The technology mix shifts over the period. ADAR-based RNA Editing is the largest line in 2025 at USD 0.76 billion, a 40% share, moving to USD 3.33 billion and 36% by 2034. CRISPR-based RNA Editing grows fastest at 21.4%, taking its share from 22% to 27%, while APOBEC-based RNA Editing (C-to-U) grows slowest at 17%. CRISPR-based RNA Editing, Chemical and Synthetic Editing Platforms and Epitranscriptomic Editing take share over the period; ADAR-based RNA Editing, APOBEC-based RNA Editing (C-to-U) and RNA Exon Editing (Trans-Splicing) give it up while still growing in absolute terms.
The edit type split puts Adenosine-to-Inosine (A-to-I) first, at USD 1.14 billion and 60% of revenue in 2025, rising to USD 4.81 billion and 52% in 2034. Splicing Modulation grows faster at 23.8% against 17.3%, moving from 10% of revenue to 14% by 2034. It cuts the same total as the technology axis from a different commercial angle, so revenue does not add across the two.
The regional order runs from North America at 50% of 2025 revenue down to Latin America at 3%. North America is worth USD 0.95 billion in 2025 and USD 4.07 billion in 2034; Europe, second at 22%, moves from USD 0.418 billion to USD 2.035 billion. Asia Pacific gain share across the period, so growth is not distributed evenly between regions.
The 2025 total is a triangulation of published figures and category proxies, short of a directly sourced total. Segment, regional and country splits are estimated on the same basis, which bounds the precision of the figures above. Coverage runs to five regions, six technology lines and ten segmentation axes across a fifteen-year window.
Market Size, 2020–2034
USD BillionRevenue in USD Billion. Values up to 2025 are actuals; 2026–2034 are forecast.
Key Takeaways
- The global rna editing market moves from USD 0.7 billion in 2020 to USD 1.9 billion in 2025 and USD 9.25 billion by 2034, the forecast period compounding at 19% a year.
- The largest line by technology is ADAR-based RNA Editing, worth USD 0.76 billion and 40% of revenue in 2025, rising to USD 3.33 billion and 36% by 2034.
- At 21.4%, CRISPR-based RNA Editing grows faster than any other technology line, moving from USD 0.418 billion and 22% of revenue in 2025 to USD 2.498 billion and 27% in 2034.
- Scenario range for 2034 runs from USD 6.2 billion in the bear case to USD 11.3 billion in the bull case, against a base-case USD 9.25 billion, the spread a plan built on this forecast has to absorb.
- The largest region is North America, generating USD 0.95 billion in 2025 (50% of the global total) and USD 4.07 billion by 2034, ahead of Europe at 22%.
- Within North America, the United States is the worked country example, at USD 0.87 billion in 2025; 91.6% of regional revenue in the base year, and USD 3.7 billion by 2034.
- The study covers 2020 through 2034 with 2025 as the base year, reporting five regions and ten segmentation axes separately, with revenue, share and a growth rate for every line in each year.
Market Trends
Revenue Share, By technology
Base year 2025ADAR-based RNA Editing leads with 40.0% of technology segment revenue.
Share of technology segment revenue, most recent base year.
Three things move over 2026-2034, and they are worth separating: the technology mix, the regional balance, and the 19% compounding underneath both.
The direction of the market is not in question in any of the three. Each line and each region grows in revenue terms; what separates them is which takes the larger part of the growth.
CRISPR-based RNA Editing outpaces APOBEC-based RNA Editing (C-to-U). 21.4% against 17%: that gap, between CRISPR-based RNA Editing and APOBEC-based RNA Editing (C-to-U), is the largest on the technology axis. Shares follow: 22% to 27% for CRISPR-based RNA Editing, 8% to 7% for APOBEC-based RNA Editing (C-to-U). In absolute terms CRISPR-based RNA Editing rises from USD 0.418 billion to USD 2.498 billion, while APOBEC-based RNA Editing (C-to-U) rises from USD 0.152 billion to USD 0.648 billion. Both grow; the gap is wide enough to reshape the mix inside a single forecast window.
Asia Pacific gain regional share. Asia Pacific moves from 21% of revenue in 2025 to 27% in 2034, worth USD 0.399 billion rising to USD 2.498 billion. Against that, North America at 50% moving to 44%, Europe at 22% moving to 22%, Latin America at 3% moving to 3%, Middle East and Africa at 4% moving to 4%, a fall in share, not in revenue. Revenue added in this market is therefore concentrating geographically instead of spreading evenly, and a participant weighted toward a share-losing region grows more slowly than the market even while its own revenue climbs.
Fifteen years without a discontinuity. Reading the series: USD 0.7 billion in 2020, USD 1.56 billion in 2024, USD 1.9 billion in 2025, USD 2.3 billion in 2026, USD 4.68 billion in 2030 and USD 9.25 billion in 2034. The forecast rate of 19% sits against 22.1% over the historical period, so the projection extends an observed trend instead of proposing a new one. That moves the planning question away from timing a turn and onto the technology and regional mixes, where the actual movement is.
Market Growth Factors
Growth is concentrated in CRISPR-based RNA Editing
Market Drivers
3- 01Growth is concentrated in CRISPR-based RNA Editing
CRISPR-based RNA Editing compounds at 21.4% against 19% for the market, rising from USD 0.418 billion in 2025 to USD 2.498 billion in 2034 and from 22% of revenue to 27%. Set against 17% at the other end of the axis, this is the line that decides whether the market's 19% holds. A portfolio weighted away from it tracks below the market even in a market growing everywhere.
- 02Regional weight, not regional count
50% of 2025 revenue (USD 0.95 billion) is generated in North America, reaching USD 4.07 billion by 2034 at an unchanged 44%. Europe adds a further 22% at USD 0.418 billion, reaching USD 2.035 billion. Together the two account for the majority of both the 2025 base and the revenue added by 2034, which is why a regional plan treating all five regions at equal weight misreads where the growth actually lands.
- 03The base has grown every year since 2020
USD 0.7 billion in 2020, USD 1.56 billion in 2024 and USD 1.9 billion in 2025: 22.1% compound growth before the forecast period even begins. From there the forecast carries 19% through to USD 9.25 billion in 2034. With the trajectory already demonstrated over fifteen years, what remains uncertain is the mix, not the direction, which is where the segment and regional sections do the work.
Growth drivers
| # | Growth driver | Impact | Gross contribution (USD Billion) | 2026-28 | 2029-31 | 2032-34 |
|---|---|---|---|---|---|---|
| 1 | Clinical progress of ADAR-based and CRISPR-based programs | High | +2.6 | High | High | Medium |
| 2 | Partnering and licensing capital | Medium-High | +1.7 | High | Medium | Medium |
| 3 | Rare disease demand and orphan incentives | Medium-High | +1.55 | Medium | High | High |
| 4 | Advances in delivery to the liver and beyond | Medium | +1.3 | Medium | High | High |
| 5 | Adoption of editing tools in discovery laboratories | Medium | +0.95 | High | Medium | Medium |
| 6 | Others | Low | +0.6 | Low | Low | Low |
| Total | +8.7 | |||||
Restraints
| # | Restraint | Impact | Estimated reduction (USD Billion) | 2026-28 | 2029-31 | 2032-34 |
|---|---|---|---|---|---|---|
| 1 | Delivery limits and off-target safety concerns | Medium-High | −0.7 | High | Medium | Medium |
| 2 | Clinical failure risk and long timelines | Medium | −0.4 | High | High | Medium |
| 3 | Manufacturing cost and intellectual property complexity | Low | −0.25 | Medium | Medium | Low |
| Total | −1.35 | |||||
Drivers contribute 8.7 USD Billion and restraints remove 1.35 USD Billion, a net 7.35 USD Billion, which is the revenue the market adds between the base year and 2034. Contributions are CDI estimates, apportioned so that they reconcile with the forecast rather than being read from it.
The 19% forecast rate rests on three things that can be measured separately: the size of the existing base, the mix shift on the technology axis, and where regional growth is concentrated.
Restraining Factors
Downside case: USD 6.2 billion by 2034, against USD 9.25 billion in the base case
Market Restraints
2- 01Downside case: USD 6.2 billion by 2034, against USD 9.25 billion in the base case
Where the forecast could miss: A safety signal or weak durability data delays pivotal programs, delivery to tissues beyond the liver stalls and funding for platform companies tightens. That path reaches USD 6.2 billion by 2034 instead of USD 9.25 billion, off an unchanged USD 1.9 billion in 2025.
- 02The largest line is not the fastest
ADAR-based RNA Editing carries 40% of 2025 revenue at USD 0.76 billion but compounds at 17.4% against 19% for the market, taking its share to 36% by 2034 even as revenue rises to USD 3.33 billion. Because it carries that much of the base, its pace holds the blended rate down more than any faster line lifts it.
Market Opportunities
Where the forecast could be beaten
Market Opportunities
2- 01Where the forecast could be beaten
What would beat the forecast: early clinical data confirm durable editing with a clean safety record, first approvals arrive ahead of plan and licensing activity accelerates. That case reaches USD 11.3 billion in 2034 against USD 9.25 billion, and it is worth testing against a reader's own read of the market.
- 02CRISPR-based RNA Editing is where share changes hands
Share on the technology axis moves toward CRISPR-based RNA Editing, from 22% in 2025 to 27% in 2034, on 21.4% growth against the market's 19% and revenue rising from USD 0.418 billion to USD 2.498 billion. Taking position there does not require displacing whoever holds ADAR-based RNA Editing, which is the harder and more expensive fight.
Market Challenges
Concentration on the technology axis
Market Challenges
2- 01Concentration on the technology axis
One line dominates: ADAR-based RNA Editing, at 40% of revenue in 2025 and 36% in 2034, worth USD 0.76 billion and USD 3.33 billion. Anything that changes demand for it changes the headline number; nothing else on the axis carries that weight.
- 02The United States is 91.6% of North America
Of North America's USD 0.95 billion in 2025, USD 0.87 billion (91.6%) comes from the United States alone, rising to USD 3.7 billion by 2034. Read as a region it looks diversified; read by weight it is not, and the regional forecast inherits whatever happens in that one market.
Segmentation Analysis
10 axesSegmentation runs along ten axes: technology, edit type, delivery method, offering, therapeutic area, target mechanism, development stage, route of administration, application and end user. Every one of them divides the same revenue, which makes them views of one market from different commercial angles, not components of it.
All six technology lines expand in revenue terms over the forecast period. Share is the dividing line; three take it, the others cede it.
By Technology · 6 segments
ADAR-based RNA Editing Led by Technology in 2025, with CRISPR-based RNA Editing Growing Fastest
- Largest ADAR-based RNA Editing · 40%
- Fastest CRISPR-based RNA Editing · 21.4%
- Moves most CRISPR-based RNA Editing · +5 pts
- Order by 2034 unchanged
| Segment | 2025 | Share | 2034 | Share | CAGR |
|---|---|---|---|---|---|
| ADAR-based RNA Editing | $0.76B | 40% | $3.33B | 36%-4 | 17.4% |
| CRISPR-based RNA Editing | $0.42B | 22% | $2.50B | 27%+5 | 21.4% |
| APOBEC-based RNA Editing (C-to-U) | $0.15B | 8% | $0.65B | 7%-1 | 17% |
| RNA Exon Editing (Trans-Splicing) | $0.19B | 10% | $0.74B | 8%-2 | 17.3% |
| Chemical and Synthetic Editing Platforms | $0.27B | 14% | $1.39B | 15%+1 | 20% |
| Epitranscriptomic Editing (m6A and Pseudouridine) | $0.11B | 6% | $0.65B | 7%+1 | 21.3% |
ADAR-based editing leads because it recruits enzymes already present in human cells, avoids foreign nucleases and has the deepest pipeline of clinical programs. CRISPR-based editing grows fastest as programmable RNA-targeting nucleases attract partnering capital and widen the range of edits that can be made, even though fewer such programs have reached patients so far. By 2034 ADAR-based RNA Editing is still ahead, making this a shift in weight, not a change of leader. Every year of the series is priced on this axis, making it the reference cut for the rest of the report.
By Edit Type · 5 segments
Adenosine-to-Inosine (A-to-I) Held the Dominant Share of the Edit type Segment in 2025
- Largest Adenosine-to-Inosine (A-to-I) · 60%
- Fastest Splicing Modulation · 23.8%
- Moves most Adenosine-to-Inosine (A-to-I) · -8 pts
- Order by 2034 changes
| Segment | 2025 | Share | 2034 | Share | CAGR |
|---|---|---|---|---|---|
| Adenosine-to-Inosine (A-to-I) | $1.14B | 60% | $4.81B | 52%-8 | 17.3% |
| Cytidine-to-Uridine (C-to-U) | $0.23B | 12% | $1.29B | 14%+2 | 21.3% |
| Exon Replacement | $0.19B | 10% | $0.83B | 9%-1 | 17.8% |
| RNA Base Modification | $0.15B | 8% | $1.02B | 11%+3 | 23.5% |
| Splicing Modulation | $0.19B | 10% | $1.29B | 14%+4 | 23.8% |
Adenosine-to-inosine conversion leads because it is the edit that natural ADAR enzymes already perform, and most clinical programs correct point mutations this way. Splicing modulation and base modification grow fastest as developers move beyond single-letter correction toward changing how transcripts are processed and tuned, which opens a wider set of diseases to treatment. Adenosine-to-Inosine (A-to-I) remains the largest line through 2034, so the axis changes in proportion, not in order.
By Delivery Method · 6 segments
Scale in Lipid Nanoparticles and Growth in Other Non-viral Methods Define the Delivery method Axis
- Largest Lipid Nanoparticles · 34%
- Fastest Other Non-viral Methods · 21.7%
- Moves most GalNAc Conjugates · +4 pts
- Order by 2034 changes
| Segment | 2025 | Share | 2034 | Share | CAGR |
|---|---|---|---|---|---|
| Lipid Nanoparticles | $0.65B | 34% | $3.33B | 36%+2 | 20% |
| Adeno-Associated Virus Vectors | $0.34B | 18% | $1.39B | 15%-3 | 16.8% |
| GalNAc Conjugates | $0.42B | 22% | $2.40B | 26%+4 | 21.5% |
| Lentiviral Vectors | $0.11B | 6% | $0.37B | 4%-2 | 14% |
| Electroporation | $0.19B | 10% | $0.65B | 7%-3 | 14.6% |
| Other Non-viral Methods | $0.19B | 10% | $1.11B | 12%+2 | 21.7% |
Lipid nanoparticles lead because they carry editing molecules to the liver and are the best understood option for manufacturing and regulatory review. GalNAc conjugates grow fastest because they give simple, repeatable delivery to liver cells with established subcutaneous dosing, and other non-viral methods broaden as developers look for ways to reach tissues beyond the liver. By 2034 Lipid Nanoparticles is still ahead, making this a shift in weight, not a change of leader.
By Offering · 5 segments
Therapeutic Candidates and Programs Both Leads the Offering Axis and Grows Fastest on It
- Largest Therapeutic Candidates and Programs · 44%
- Fastest Therapeutic Candidates and Programs · 22.5%
- Moves most Therapeutic Candidates and Programs · +12 pts
- Order by 2034 unchanged
| Segment | 2025 | Share | 2034 | Share | CAGR |
|---|---|---|---|---|---|
| Therapeutic Candidates and Programs | $0.84B | 44% | $5.18B | 56%+12 | 22.5% |
| Reagents and Kits | $0.42B | 22% | $1.39B | 15%-7 | 14.3% |
| Instruments and Platforms | $0.23B | 12% | $0.83B | 9%-3 | 15.5% |
| Software and Bioinformatics | $0.11B | 6% | $0.56B | 6% | 19.2% |
| Services | $0.30B | 16% | $1.29B | 14%-2 | 17.5% |
Therapeutic candidates and programs lead because collaboration, licensing and milestone income from developer partnerships outweighs spend on laboratory consumables. The same group grows fastest as programs advance through clinical stages and each step triggers payments, while reagents, kits and instruments rise more slowly with the number of active discovery laboratories. By 2034 Therapeutic Candidates and Programs is still ahead, making this a shift in weight, not a change of leader.
By Therapeutic Area · 7 segments
By Therapeutic Area
- Largest Rare Genetic Disorders · 30%
- Fastest Oncology · 21.8%
- Moves most Rare Genetic Disorders · -4 pts
- Order by 2034 changes
| Segment | 2025 | Share | 2034 | Share | CAGR |
|---|---|---|---|---|---|
| Rare Genetic Disorders | $0.57B | 30% | $2.40B | 26%-4 | 17.3% |
| Neurological Disorders | $0.38B | 20% | $2.04B | 22%+2 | 20.5% |
| Oncology | $0.27B | 14% | $1.57B | 17%+3 | 21.8% |
| Ophthalmic Disorders | $0.15B | 8% | $0.74B | 8% | 19.2% |
| Cardiovascular and Metabolic Disorders | $0.23B | 12% | $1.29B | 14%+2 | 21.3% |
| Infectious Diseases | $0.11B | 6% | $0.46B | 5%-1 | 16.8% |
| Liver Diseases | $0.19B | 10% | $0.74B | 8%-2 | 16.3% |
2025 to 2034 revenue and share by line: Rare Genetic Disorders USD 0.57 billion to USD 2.405 billion (30% to 26%), Neurological Disorders USD 0.38 billion to USD 2.035 billion (20% to 22%), Oncology USD 0.266 billion to USD 1.573 billion (14% to 17%), Cardiovascular and Metabolic Disorders USD 0.228 billion to USD 1.295 billion (12% to 14%), Liver Diseases USD 0.19 billion to USD 0.74 billion (10% to 8%), Ophthalmic Disorders USD 0.152 billion to USD 0.74 billion (8% to 8%), Infectious Diseases USD 0.114 billion to USD 0.463 billion (6% to 5%). Oncology Outpaces the Axis While Rare Genetic Disorders Holds the Largest Share Rare genetic disorders lead because single-mutation diseases suit correction of a defined transcript error and attract orphan incentives. Oncology and cardiovascular and metabolic disorders grow fastest as developers move into larger patient populations and tissues reachable through newer delivery routes, which broadens the addressable base beyond ultra-rare conditions. By 2034 Rare Genetic Disorders is still ahead, making this a shift in weight, not a change of leader.
By Target Mechanism · 6 segments
Scale in Correction of Pathogenic Point Mutations and Growth in Splice Site Editing Define the Target mechanism Axis
- Largest Correction of Pathogenic Point Mutations · 40%
- Fastest Splice Site Editing · 21.7%
- Moves most Correction of Pathogenic Point Mutations · -6 pts
- Order by 2034 changes
| Segment | 2025 | Share | 2034 | Share | CAGR |
|---|---|---|---|---|---|
| Correction of Pathogenic Point Mutations | $0.76B | 40% | $3.15B | 34%-6 | 17.1% |
| Protein Upregulation | $0.34B | 18% | $1.85B | 20%+2 | 20.6% |
| Protein Modulation | $0.27B | 14% | $1.39B | 15%+1 | 20.1% |
| Start Codon and Stop Codon Editing | $0.19B | 10% | $0.93B | 10% | 19.2% |
| Post-translational Modification Site Editing | $0.15B | 8% | $0.83B | 9%+1 | 20.8% |
| Splice Site Editing | $0.19B | 10% | $1.11B | 12%+2 | 21.7% |
Correction of pathogenic point mutations leads because it addresses the clearest cases where one changed letter causes disease and the benefit is easy to measure. Protein upregulation and splice site editing grow fastest as developers target diseases of too little protein or faulty processing, where the transcript is changed temporarily and dosing can be adjusted. The order does not change: Correction of Pathogenic Point Mutations is still largest in 2034, and what moves is how much it holds.
By Development Stage · 5 segments
Preclinical Led by Development stage in 2025, with Phase III and Beyond Growing Fastest
- Largest Preclinical · 34%
- Fastest Phase III and Beyond · 26.2%
- Moves most Discovery and Research · -10 pts
- Order by 2034 changes
| Segment | 2025 | Share | 2034 | Share | CAGR |
|---|---|---|---|---|---|
| Discovery and Research | $0.46B | 24% | $1.29B | 14%-10 | 12.3% |
| Preclinical | $0.65B | 34% | $2.59B | 28%-6 | 16.7% |
| Phase I | $0.42B | 22% | $2.40B | 26%+4 | 21.5% |
| Phase II | $0.27B | 14% | $2.04B | 22%+8 | 25.4% |
| Phase III and Beyond | $0.11B | 6% | $0.93B | 10%+4 | 26.2% |
Preclinical programs lead because most active developers still sit at animal studies and candidate selection, where collaboration funding is concentrated. Later stages grow fastest as the first programs reach patients, trigger milestone payments and attract larger partners, so revenue shifts toward clinical stages across the forecast period. By 2034 Preclinical is still ahead, making this a shift in weight, not a change of leader.
By Route of Administration · 6 segments
Intravenous Led by Route of administration in 2025, with Subcutaneous Growing Fastest
- Largest Intravenous · 40%
- Fastest Subcutaneous · 22.5%
- Moves most Subcutaneous · +6 pts
- Order by 2034 changes
| Segment | 2025 | Share | 2034 | Share | CAGR |
|---|---|---|---|---|---|
| Intravenous | $0.76B | 40% | $3.33B | 36%-4 | 17.8% |
| Subcutaneous | $0.42B | 22% | $2.59B | 28%+6 | 22.5% |
| Intrathecal | $0.27B | 14% | $1.29B | 14% | 19.2% |
| Intravitreal | $0.15B | 8% | $0.65B | 7%-1 | 17.5% |
| Intramuscular | $0.15B | 8% | $0.65B | 7%-1 | 17.5% |
| Intracerebroventricular | $0.15B | 8% | $0.74B | 8% | 19.2% |
Intravenous dosing leads because liver-directed programs, which are the most advanced, are delivered through the bloodstream. Subcutaneous delivery grows fastest as conjugates and improved formulations allow simple clinic-based or self-administered dosing, which suits chronic treatment and lowers the burden on patients and treatment centres. Intravenous remains the largest line through 2034, so the axis changes in proportion, not in order.
By Application · 5 segments
Therapeutics Development Holds the Largest Application Share and Is Still the Quickest to Grow
- Largest Therapeutics Development · 52%
- Fastest Therapeutics Development · 21.6%
- Moves most Therapeutics Development · +10 pts
- Order by 2034 changes
| Segment | 2025 | Share | 2034 | Share | CAGR |
|---|---|---|---|---|---|
| Therapeutics Development | $0.99B | 52% | $5.74B | 62%+10 | 21.6% |
| Drug Discovery and Target Validation | $0.34B | 18% | $1.29B | 14%-4 | 15.9% |
| Basic and Translational Research | $0.38B | 20% | $1.29B | 14%-6 | 14.6% |
| Diagnostics and Biomarker Development | $0.11B | 6% | $0.56B | 6% | 19.2% |
| Agricultural and Industrial Biotechnology | $0.08B | 4% | $0.37B | 4% | 19.2% |
Therapeutics development leads because partnership payments tied to clinical programs form the largest source of revenue in this market. It also grows fastest as programs advance and attract further funding. Drug discovery and academic research remain important buyers of tools, but they grow more slowly because their spending follows laboratory budgets and not milestone events. By 2034 Therapeutics Development is still ahead, making this a shift in weight, not a change of leader.
By End User · 5 segments
Pharmaceutical Companies Outpaces the Axis While Biotechnology Companies Holds the Largest Share
- Largest Biotechnology Companies · 46%
- Fastest Pharmaceutical Companies · 22.2%
- Moves most Academic and Research Institutes · -7 pts
- Order by 2034 unchanged
| Segment | 2025 | Share | 2034 | Share | CAGR |
|---|---|---|---|---|---|
| Biotechnology Companies | $0.87B | 46% | $4.44B | 48%+2 | 19.8% |
| Pharmaceutical Companies | $0.46B | 24% | $2.77B | 30%+6 | 22.2% |
| Academic and Research Institutes | $0.34B | 18% | $1.02B | 11%-7 | 12.9% |
| Contract Research and Manufacturing Organizations | $0.15B | 8% | $0.74B | 8% | 19.2% |
| Hospitals and Specialty Clinics | $0.08B | 4% | $0.28B | 3%-1 | 15.5% |
Biotechnology companies lead because most RNA editing programs are held by small and mid-sized developers that run discovery in-house and sign partnerships. Pharmaceutical companies grow fastest as they license platforms, take over later-stage programs and fund trials, while academic institutes grow more slowly as grant budgets expand at a steadier pace. The order does not change: Biotechnology Companies is still largest in 2034, and what moves is how much it holds.
Regional Insights
Regional Revenue Share
Base year 2025Share of global revenue in the base year.
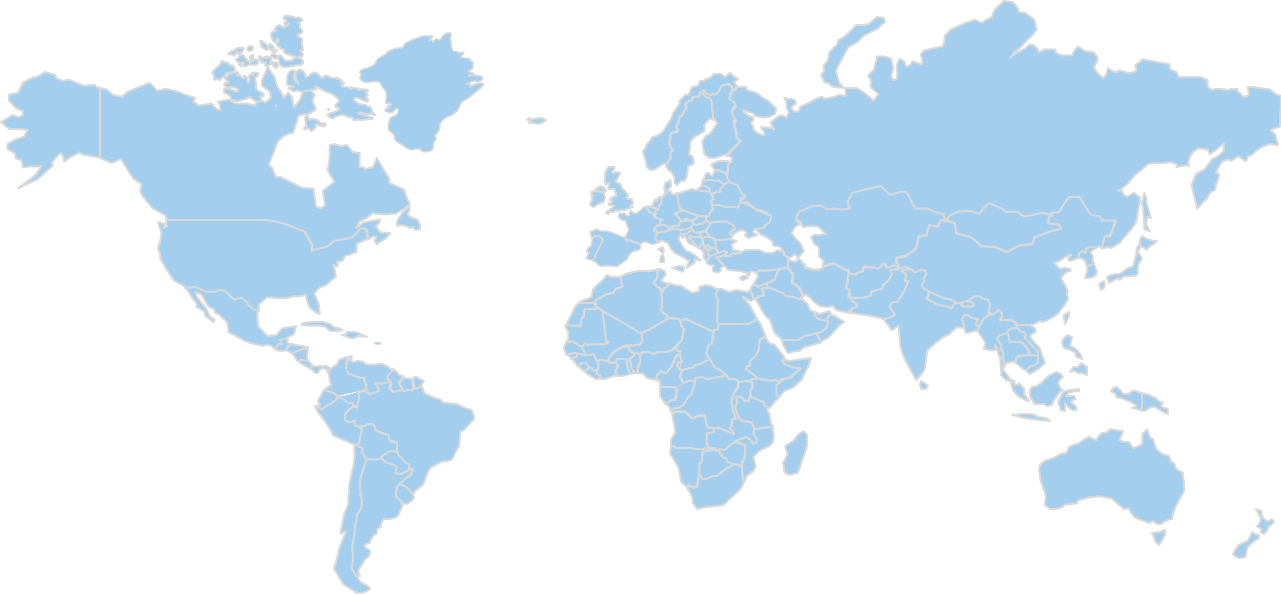
Only the leading region's share is published outside the report; pins mark the region, not a specific country.
North America Market Analysis
The largest region covered, and the one giving up the most — 6 points of share move elsewhere by 2034, while revenue still grows 4.3×.
- Rank 1 of 5
- 2025 share 50%
- By 2034 44%
- Revenue $0.95B → $4.07B
USD 0.95 billion of 2025 revenue is generated in North America, 50% of the global rna editing market rising to USD 4.07 billion in 2034. It is a dominant region on this axis, first by revenue throughout the period.
By 2034 the share stands at 44%, and the region keeps growing in absolute terms while others expand faster, a change in relative weight, not a decline in demand.
ADAR-based RNA Editing leads here as it does globally, at 40% of 2025 revenue, and CRISPR-based RNA Editing again grows fastest at 21.4%. Revenue for North America is broken out by every segmentation axis and by country in the full report.
United States
Sets the pace for North America at 91.6% of it, growing 4.3×.
- In region 1 of 2
- Of region 91.6%
- Of global 45.8%
- Revenue $0.87B → $3.70B
The United States is the largest market within North America, generating USD 0.87 billion in 2025 and projected to reach USD 3.7 billion by 2034. Because it is 91.6% of the region in the base year, North America's totals move with this one country instead of a spread of them. Set against USD 0.95 billion and USD 4.07 billion for the region, it is why this market, and not a smaller one, is the one reported in full.
the United States buys along the same lines as the market globally; ADAR-based RNA Editing first at 40% of 2025 revenue and 36% in 2034, CRISPR-based RNA Editing fastest at 21.4% on a share moving from 22% to 27%. Its 91.6% weight in North America means those movements carry straight into the regional totals. The United States carries its own technology breakdown in the full report.
RNA editing therapeutics in the United States are regulated by the Food and Drug Administration. Depending on the modality, products are reviewed as biologics or as drugs, with oligonucleotide-based editors typically handled by the Center for Drug Evaluation and Research and vector-delivered editors by the Center for Biologics Evaluation and Research. A sponsor files an Investigational New Drug application before clinical work begins and a marketing application before launch, and may seek expedited designations for serious conditions. Manufacturing must follow current good manufacturing practice, and labelling must meet the agency's prescribing information rules. Research-use reagents sit outside this route but must be labelled as not for clinical use.
Wave Life Sciences Ltd., Korro Bio, Inc., ProQR Therapeutics N.V., Shape Therapeutics Inc., Ascidian Therapeutics, Inc., AIRNA Corporation, Roche Holding AG, Ionis Pharmaceuticals, Inc., Arrowhead Pharmaceuticals, Inc., Beam Therapeutics Inc., Editas Medicine, Inc., Intellia Therapeutics, Inc., CRISPR Therapeutics AG, Prime Medicine, Inc., Sarepta Therapeutics, Inc., Thermo Fisher Scientific Inc., Merck KGaA, Danaher Corporation, Agilent Technologies, Inc., Integrated DNA Technologies, Inc., Twist Bioscience Corporation, GenScript Biotech Corporation, Eli Lilly and Company, Novo Nordisk A/S, Skyhawk Therapeutics, Inc., Rznomics Inc., Ethris GmbH and Bio-Techne Corporation are the suppliers covered in the United States. Volume sits in ADAR-based RNA Editing at 40% of 2025 revenue; movement sits in CRISPR-based RNA Editing at 21.4% growth. Country-level positioning and shares for each of these companies are part of the full report, not of this summary.
Canada
2nd-largest in North America, growing 4.7×.
- In region 2 of 2
- Of region 6.3%
- Of global 3.2%
- Revenue $0.06B → $0.28B
Within North America, Canada accounts for 6.3% of regional revenue and 3.2% of the global total, worth USD 0.06 billion in 2025 and USD 0.28 billion by 2034.
Europe Market Analysis
The 2nd-largest region covered, holding its share flat through 2034, while revenue still grows 4.9×.
- Rank 2 of 5
- 2025 share 22%
- By 2034 22%
- Revenue $0.42B → $2.04B
In Europe, 22% of global revenue puts 2025 at USD 0.418 billion and reaches USD 2.035 billion by 2034. Among the five regions it ranks second by revenue in both years.
Its share moves to 22% by 2034, and the region keeps growing in absolute terms while others expand faster, a change in relative weight, not a decline in demand.
ADAR-based RNA Editing leads here as it does globally, at 40% of 2025 revenue, and CRISPR-based RNA Editing again grows fastest at 21.4%. Europe is reported axis by axis and country by country in the full study.
United Kingdom
The largest market in Europe, growing 4.7×.
- In region 1 of 3
- Of region 26.3%
- Of global 5.8%
- Revenue $0.11B → $0.52B
USD 0.11 billion of Europe's 2025 revenue is generated in the United Kingdom, the region's largest market, reaching USD 0.52 billion by 2034. It accounts for 26.3% of regional revenue in the base year, the largest single share without dominating the region outright. Regional revenue of USD 0.418 billion in 2025 and USD 2.035 billion in 2034 sits around it, and it is the country used wherever the full report cuts a figure by geography.
the United Kingdom buys along the same lines as the market globally; ADAR-based RNA Editing first at 40% of 2025 revenue and 36% in 2034, CRISPR-based RNA Editing fastest at 21.4% on a share moving from 22% to 27%. Its 26.3% weight in Europe means those movements carry straight into the regional totals. Per-technology revenue for the United Kingdom appears on its own in the full report.
In the United Kingdom, RNA editing medicines fall under the Medicines and Healthcare products Regulatory Agency. A developer needs a clinical trial authorisation before human studies and a marketing authorisation before sale. Editors delivered through viral vectors or modified cells are treated as advanced therapy medicinal products, which carry additional expectations on traceability and long-term follow-up. Manufacturers must hold the relevant licence and comply with good manufacturing practice, and product information must follow the national labelling requirements. Ethics review and oversight of genetically modified organisms apply alongside the medicines framework, and the agency offers scientific advice to sponsors early in development.
Competition in the United Kingdom runs between the suppliers this study tracks: Wave Life Sciences Ltd., Korro Bio, Inc., ProQR Therapeutics N.V., Shape Therapeutics Inc., Ascidian Therapeutics, Inc., AIRNA Corporation, Roche Holding AG, Ionis Pharmaceuticals, Inc., Arrowhead Pharmaceuticals, Inc., Beam Therapeutics Inc., Editas Medicine, Inc., Intellia Therapeutics, Inc., CRISPR Therapeutics AG, Prime Medicine, Inc., Sarepta Therapeutics, Inc., Thermo Fisher Scientific Inc., Merck KGaA, Danaher Corporation, Agilent Technologies, Inc., Integrated DNA Technologies, Inc., Twist Bioscience Corporation, GenScript Biotech Corporation, Eli Lilly and Company, Novo Nordisk A/S, Skyhawk Therapeutics, Inc., Rznomics Inc., Ethris GmbH and Bio-Techne Corporation. The commercially relevant division is 40% of 2025 revenue in ADAR-based RNA Editing, where the volume is, against 21.4% growth in CRISPR-based RNA Editing, where share moves. A supplier weighted toward Europe is competing over a base of USD 0.418 billion in 2025 reaching USD 2.035 billion by 2034, 22% of global revenue at the start of that period.
Germany
2nd-largest in Europe, growing 4.5×.
- In region 2 of 3
- Of region 22.7%
- Of global 5%
- Revenue $0.10B → $0.43B
5% of global revenue is generated in Germany; USD 0.095 billion in 2025, reaching USD 0.43 billion in 2034, and 22.7% of Europe.
France
3rd-largest in Europe, growing 4.3×.
- In region 3 of 3
- Of region 14.4%
- Of global 3.2%
- Revenue $0.06B → $0.26B
Within Europe, France accounts for 14.4% of regional revenue and 3.2% of the global total, worth USD 0.06 billion in 2025 and USD 0.26 billion by 2034.
Asia Pacific Market Analysis
The 3rd-largest region covered — it picks up 6 points of share by 2034, while revenue still grows 6.3×.
- Rank 3 of 5
- 2025 share 21%
- By 2034 27%
- Revenue $0.40B → $2.50B
21% of the global rna editing market sits in Asia Pacific in 2025, worth USD 0.399 billion rising to USD 2.498 billion in 2034. That makes it the third-largest region covered, in 2025 and again in 2034.
Its share rises to 27% over the forecast period, so the region grows faster than the market's 19% and takes a larger part of the revenue added by 2034 than its 2025 weight implies.
ADAR-based RNA Editing leads here as it does globally, at 40% of 2025 revenue, and CRISPR-based RNA Editing again grows fastest at 21.4%. Asia Pacific is reported axis by axis and country by country in the full study.
China
The largest market in Asia Pacific, growing 6.7×.
- In region 1 of 3
- Of region 37.6%
- Of global 7.9%
- Revenue $0.15B → $1B
37.6% of Asia Pacific's base-year revenue comes from China; USD 0.15 billion, rising to USD 1 billion by 2034. 37.6% of the region in the base year makes it the largest market here without making it the region. The region itself runs USD 0.399 billion to USD 2.498 billion over the same period, and this is the market carrying the country-level detail in the full report.
China buys along the same lines as the market globally; ADAR-based RNA Editing first at 40% of 2025 revenue and 36% in 2034, CRISPR-based RNA Editing fastest at 21.4% on a share moving from 22% to 27%. With 37.6% of Asia Pacific concentrated here, a change in this country's mix is visible in the regional figures instead of being diluted by its neighbours. China carries its own technology breakdown in the full report.
In China, the National Medical Products Administration governs RNA editing therapies, with its Center for Drug Evaluation conducting technical review. Sponsors must obtain approval for clinical trials and then register the product for marketing under the Drug Administration Law. Gene-modifying products receive close scrutiny, and human genetic resources rules, administered by the health and science authorities, restrict how patient samples and related data may be collected and shared with foreign parties. Manufacturing sites must meet national good manufacturing practice standards, and labelling must appear in Chinese in the prescribed format. Imported products require additional registration steps before they can be sold.
Wave Life Sciences Ltd., Korro Bio, Inc., ProQR Therapeutics N.V., Shape Therapeutics Inc., Ascidian Therapeutics, Inc., AIRNA Corporation, Roche Holding AG, Ionis Pharmaceuticals, Inc., Arrowhead Pharmaceuticals, Inc., Beam Therapeutics Inc., Editas Medicine, Inc., Intellia Therapeutics, Inc., CRISPR Therapeutics AG, Prime Medicine, Inc., Sarepta Therapeutics, Inc., Thermo Fisher Scientific Inc., Merck KGaA, Danaher Corporation, Agilent Technologies, Inc., Integrated DNA Technologies, Inc., Twist Bioscience Corporation, GenScript Biotech Corporation, Eli Lilly and Company, Novo Nordisk A/S, Skyhawk Therapeutics, Inc., Rznomics Inc., Ethris GmbH and Bio-Techne Corporation are the suppliers covered in China. The commercially relevant division is 40% of 2025 revenue in ADAR-based RNA Editing, where the volume is, against 21.4% growth in CRISPR-based RNA Editing, where share moves. A supplier weighted toward Asia Pacific is competing over a base of USD 0.399 billion in 2025 reaching USD 2.498 billion by 2034, 21% of global revenue at the start of that period.
Japan
2nd-largest in Asia Pacific, growing 5.0×.
- In region 2 of 3
- Of region 30.1%
- Of global 6.3%
- Revenue $0.12B → $0.60B
Japan is sized at USD 0.12 billion in 2025, rising to USD 0.6 billion by 2034; 6.3% of global revenue and 30.1% of Asia Pacific. It is reported separately from China across every segmentation axis in the full report.
South Korea
3rd-largest in Asia Pacific, growing 5.8×.
- In region 3 of 3
- Of region 11.3%
- Of global 2.4%
- Revenue $0.04B → $0.26B
2.4% of global revenue is generated in South Korea; USD 0.045 billion in 2025, reaching USD 0.26 billion in 2034, and 11.3% of Asia Pacific.
Latin America Market Analysis
The 5th-largest region covered, holding its share flat through 2034, while revenue still grows 4.9×.
- Rank 5 of 5
- 2025 share 3%
- By 2034 3%
- Revenue $0.06B → $0.28B
USD 0.057 billion of 2025 revenue is generated in Latin America, 3% of the global rna editing market with USD 0.278 billion projected for 2034. It is a marginal region on this axis, fifth by revenue throughout the period.
By 2034 the share stands at 3%, while nothing contracts here; other regions simply grow faster, which shows up as relative weight, not as falling revenue.
ADAR-based RNA Editing leads here as it does globally, at 40% of 2025 revenue, and CRISPR-based RNA Editing again grows fastest at 21.4%. Latin America is reported axis by axis and country by country in the full study.
Brazil
The largest market in Latin America, growing 4.8×.
- In region 1 of 2
- Of region 45.6%
- Of global 1.4%
- Revenue $0.03B → $0.13B
The largest single market in Latin America is Brazil, at USD 0.026 billion in 2025 and USD 0.125 billion in 2034. At 45.6% of the region in 2025 it leads, but a majority of Latin America's revenue is generated in other markets. The region itself runs USD 0.057 billion to USD 0.278 billion over the same period, and this is the market carrying the country-level detail in the full report.
Composition here matches the global split: the largest line is ADAR-based RNA Editing at 40% of 2025 revenue, easing to 36% by 2034, and the fastest is CRISPR-based RNA Editing at 21.4%, from 22% to 27%. Because the country carries 45.6% of Latin America, a movement in its own mix shows up in the regional totals instead of being averaged away by neighbouring markets. Revenue by technology for Brazil is reported separately in the full report.
Brazil's health regulator, the National Health Surveillance Agency known as ANVISA, oversees RNA editing products. Clinical research needs ANVISA authorisation and ethics committee approval through the national research ethics system. Marketing requires product registration, and gene-based therapies are handled under the advanced therapy rules, which set expectations for quality, safety and post-market follow-up. Manufacturing facilities, including those abroad, must demonstrate good manufacturing practice compliance and are often inspected by the agency. Labelling and package leaflets must be in Portuguese and follow ANVISA's format. Work involving genetically modified organisms also falls under national biosafety rules.
Competition in Brazil runs between the suppliers this study tracks: Wave Life Sciences Ltd., Korro Bio, Inc., ProQR Therapeutics N.V., Shape Therapeutics Inc., Ascidian Therapeutics, Inc., AIRNA Corporation, Roche Holding AG, Ionis Pharmaceuticals, Inc., Arrowhead Pharmaceuticals, Inc., Beam Therapeutics Inc., Editas Medicine, Inc., Intellia Therapeutics, Inc., CRISPR Therapeutics AG, Prime Medicine, Inc., Sarepta Therapeutics, Inc., Thermo Fisher Scientific Inc., Merck KGaA, Danaher Corporation, Agilent Technologies, Inc., Integrated DNA Technologies, Inc., Twist Bioscience Corporation, GenScript Biotech Corporation, Eli Lilly and Company, Novo Nordisk A/S, Skyhawk Therapeutics, Inc., Rznomics Inc., Ethris GmbH and Bio-Techne Corporation. Volume sits in ADAR-based RNA Editing at 40% of 2025 revenue; movement sits in CRISPR-based RNA Editing at 21.4% growth. A supplier weighted toward Latin America is competing over a base of USD 0.057 billion in 2025 reaching USD 0.278 billion by 2034, 3% of global revenue at the start of that period.
Mexico
2nd-largest in Latin America, growing 5.0×.
- In region 2 of 2
- Of region 21.1%
- Of global 0.6%
- Revenue $0.01B → $0.06B
Mexico is sized at USD 0.012 billion in 2025, rising to USD 0.06 billion by 2034; 0.6% of global revenue and 21.1% of Latin America. It is reported separately from Brazil across every segmentation axis in the full report.
Middle East and Africa Market Analysis
The 4th-largest region covered, holding its share flat through 2034, while revenue still grows 4.9×.
- Rank 4 of 5
- 2025 share 4%
- By 2034 4%
- Revenue $0.08B → $0.37B
USD 0.076 billion of 2025 revenue is generated in Middle East and Africa, 4% of the global rna editing market and reaches USD 0.37 billion by 2034. That makes it the fourth-largest region covered, in 2025 and again in 2034.
Its share moves to 4% by 2034, and the region keeps growing in absolute terms while others expand faster, a change in relative weight, not a decline in demand.
The technology mix reported at global level applies here, with ADAR-based RNA Editing the largest line at 40% of 2025 revenue and CRISPR-based RNA Editing the fastest-growing at 21.4%. Revenue for Middle East and Africa is broken out by every segmentation axis and by country in the full report.
Saudi Arabia
The largest market in Middle East and Africa, growing 5.0×.
- In region 1 of 2
- Of region 28.9%
- Of global 1.2%
- Revenue $0.02B → $0.11B
Saudi Arabia is the largest market within Middle East and Africa, generating USD 0.022 billion in 2025 and projected to reach USD 0.11 billion by 2034. At 28.9% of the region in 2025 it leads, but a majority of Middle East and Africa's revenue is generated in other markets. Against regional totals of USD 0.076 billion in 2025 and USD 0.37 billion in 2034, it is the country the full report breaks out in detail.
Composition here matches the global split: the largest line is ADAR-based RNA Editing at 40% of 2025 revenue, easing to 36% by 2034, and the fastest is CRISPR-based RNA Editing at 21.4%, from 22% to 27%. Because the country carries 28.9% of Middle East and Africa, a movement in its own mix shows up in the regional totals instead of being averaged away by neighbouring markets. Per-technology revenue for Saudi Arabia appears on its own in the full report.
In Saudi Arabia, the Saudi Food and Drug Authority regulates RNA editing medicines. Sponsors seek approval for clinical trials and then submit a registration dossier for marketing, which is generally aligned with international technical standards and may draw on approvals granted by reference regulators. Biological and gene-based products receive additional quality and safety review. Manufacturers must show compliance with good manufacturing practice, and the authority may inspect sites. Labelling must include Arabic text alongside English, and the authority requires a local marketing authorisation holder. Post-marketing safety reporting obligations apply once the product is on the market.
Wave Life Sciences Ltd., Korro Bio, Inc., ProQR Therapeutics N.V., Shape Therapeutics Inc., Ascidian Therapeutics, Inc., AIRNA Corporation, Roche Holding AG, Ionis Pharmaceuticals, Inc., Arrowhead Pharmaceuticals, Inc., Beam Therapeutics Inc., Editas Medicine, Inc., Intellia Therapeutics, Inc., CRISPR Therapeutics AG, Prime Medicine, Inc., Sarepta Therapeutics, Inc., Thermo Fisher Scientific Inc., Merck KGaA, Danaher Corporation, Agilent Technologies, Inc., Integrated DNA Technologies, Inc., Twist Bioscience Corporation, GenScript Biotech Corporation, Eli Lilly and Company, Novo Nordisk A/S, Skyhawk Therapeutics, Inc., Rznomics Inc., Ethris GmbH and Bio-Techne Corporation are the suppliers covered in Saudi Arabia. Volume sits in ADAR-based RNA Editing at 40% of 2025 revenue; movement sits in CRISPR-based RNA Editing at 21.4% growth. The commercial size of that position is USD 0.076 billion in 2025 and USD 0.37 billion by 2034, 4% of the global total in the base year.
Israel
2nd-largest in Middle East and Africa, growing 5.3×.
- In region 2 of 2
- Of region 26.3%
- Of global 1.1%
- Revenue $0.02B → $0.10B
1.1% of global revenue is generated in Israel; USD 0.02 billion in 2025, reaching USD 0.105 billion in 2034, and 26.3% of Middle East and Africa.
Request this sample to see the full data tables and segment-level detail behind this analysis.
Report Coverage
This report assesses the market across every segment, with revenue and a growth rate for each line in each year of the study period. It covers the drivers, trends, opportunities, restraints and challenges shaping growth, the competitive landscape and the companies profiled, and the research methodology behind every estimate. Segmentation is reported by technology, edit type, delivery method, offering, therapeutic area, target mechanism, development stage, route of administration, application, end user, and regional analysis covers North America, Europe, Asia Pacific, Latin America, Middle East and Africa, each broken out by country.
Competitive Landscape
Position on the Technology Axis Decides Competitive Standing
Suppliers in scope: Wave Life Sciences Ltd., Korro Bio, Inc., ProQR Therapeutics N.V., Shape Therapeutics Inc., Ascidian Therapeutics, Inc., AIRNA Corporation, Roche Holding AG, Ionis Pharmaceuticals, Inc., Arrowhead Pharmaceuticals, Inc., Beam Therapeutics Inc., Editas Medicine, Inc., Intellia Therapeutics, Inc., CRISPR Therapeutics AG, Prime Medicine, Inc., Sarepta Therapeutics, Inc., Thermo Fisher Scientific Inc., Merck KGaA, Danaher Corporation, Agilent Technologies, Inc., Integrated DNA Technologies, Inc., Twist Bioscience Corporation, GenScript Biotech Corporation, Eli Lilly and Company, Novo Nordisk A/S, Skyhawk Therapeutics, Inc., Rznomics Inc., Ethris GmbH and Bio-Techne Corporation.
The technology axis, not the regional one, is where competition happens. ADAR-based RNA Editing is 40% of 2025 revenue at USD 0.76 billion and still 36% in 2034, so it is where the volume sits and where an incumbent's position is hardest to move. Movement is concentrated in CRISPR-based RNA Editing; 21.4% growth, against 17% at the other end of the axis in APOBEC-based RNA Editing (C-to-U). Holding the first and taking the second are separate capabilities, which is why a market of USD 1.9 billion supports as many suppliers as it does.
Suppliers separate on the strength of their editing platform and the data behind it: demonstrated editing efficiency, control of off-target activity and the durability of effect in animals and patients. Delivery know-how, particularly access to liver-targeting chemistry and nanoparticle formulation, and regulatory experience with oligonucleotide and gene-therapy filings give the largest players an advantage, as do manufacturing capacity and the balance sheet to fund long trials. Smaller and private developers compete on a narrow platform, a single disease focus or partnerships that share cost, while tool suppliers win on reliability, catalogue breadth and support for discovery laboratories.
Presence matters unevenly by region. With 50% of 2025 revenue in North America and 22% in Europe, a supplier's coverage of those two decides most of its addressable base before any product question arises.
Company-level profiles, financials, shares and development histories are held in the full report and not in this summary.
List of Key RNA Editing Market Companies Profiled
28 companies profiled. Company profiles, including financials, product portfolios and recent developments, are part of the full report.
- Wave Life Sciences Ltd.(United States)
- Korro Bio, Inc.(United States)
- ProQR Therapeutics N.V.(Netherlands)
- Shape Therapeutics Inc.(United States)
- Ascidian Therapeutics, Inc.(United States)
- AIRNA Corporation(United States)
- Roche Holding AG(Switzerland)
- Ionis Pharmaceuticals, Inc.(United States)
- Arrowhead Pharmaceuticals, Inc.(United States)
- Beam Therapeutics Inc.(United States)
- Editas Medicine, Inc.(United States)
- Intellia Therapeutics, Inc.(United States)
- CRISPR Therapeutics AG(Switzerland)
- Prime Medicine, Inc.(United States)
- Sarepta Therapeutics, Inc.(United States)
- Thermo Fisher Scientific Inc.(United States)
- Merck KGaA(Germany)
- Danaher Corporation(United States)
- Agilent Technologies, Inc.(United States)
- Integrated DNA Technologies, Inc.(United States)
- Twist Bioscience Corporation(United States)
- GenScript Biotech Corporation(China)
- Eli Lilly and Company(United States)
- Novo Nordisk A/S(Denmark)
- Skyhawk Therapeutics, Inc.(United States)
- Rznomics Inc.(South Korea)
- Ethris GmbH(Germany)
- Bio-Techne Corporation(United States)
Geographic Coverage
Every market below is broken out separately in the report.
North America
3Europe
8Asia Pacific
12Latin America
3Middle East and Africa
4Key Insights
Report Scope
Study parameters & segmentationThis study covers market size and forecasts over the 2020–2034 period, segmentation across 10 axes (Technology, Edit Type, Delivery Method, Offering, Therapeutic Area, Target Mechanism, Development Stage, Route of Administration, Application, End User), regional analysis for 5 regions and their constituent countries, a competitive landscape profiling 28 key companies, and the research methodology behind every estimate.
Segmentation
10 axes + regionQuestions This Report Answers
6 questionsWhat is the market size and growth rate, globally and by region?
How is the market segmented, and which segments lead?
Which regions and countries are covered, and how do they compare?
What are the key drivers, restraints, opportunities and challenges?
Who are the leading companies operating in this market?
What trends are expected to shape the market through the forecast period?
Frequently Asked Questions
01What is the RNA Editing Market projected to reach?
USD 9.25 USD Billion by 2034, CAGR 19%
02What years does this report cover?
Study period 2020–2034, base year 2025, historical data 2020-2024, forecast period 2026-2034.
03Which regions are covered?
North America, Europe, Asia Pacific, Latin America, Middle East and Africa.
04Which region accounted for the largest market share?
North America leads with 50% of global revenue through 2034.
05Which segment leads the market?
ADAR-based RNA Editing is the largest line by technology, at 40% of revenue in 2025.
06Who are the key companies profiled?
Wave Life Sciences Ltd., Korro Bio, Inc., ProQR Therapeutics N.V., Shape Therapeutics Inc., Ascidian Therapeutics, Inc., AIRNA Corporation, Roche Holding AG, Ionis Pharmaceuticals, Inc., Arrowhead Pharmaceuticals, Inc., Beam Therapeutics Inc., Editas Medicine, Inc., Intellia Therapeutics, Inc., CRISPR Therapeutics AG, Prime Medicine, Inc., Sarepta Therapeutics, Inc., Thermo Fisher Scientific Inc., Merck KGaA, Danaher Corporation, Agilent Technologies, Inc., Integrated DNA Technologies, Inc., Twist Bioscience Corporation, GenScript Biotech Corporation, Eli Lilly and Company, Novo Nordisk A/S, Skyhawk Therapeutics, Inc., Rznomics Inc., Ethris GmbH, Bio-Techne Corporation. Full profiles are part of the paid report.
07Can the segmentation be customized?
Yes. Custom data cuts by geography, segment, or competitor set are available on request.
Why choose CDI
Need this report shaped around your question?
The scope isn't fixed. Tell us what your team needs that the standard edition doesn't cover, and an analyst will come back on what can be adjusted and how long it takes, before you commit to anything.
Most licences include 30–60 hours of customization at no extra cost. See what each licence includes
Additional Companies
Add competitors, suppliers or the peer set you benchmark against to the companies already covered.
Deeper Competitive View
Sharpen the landscape work around your own position: product line, channel, or a named shortlist of rivals.
Extra Segment Splits
Break the market down along an axis the standard scope doesn't cut it by, or go a level deeper inside one.
Application Focus
Narrow the analysis to the specific use cases and end users your team actually sells into.
Different Time Frame
Move the base year, or widen the historical and forecast windows the study is built on.
Country-Level Detail
Go below region level into the individual countries that matter to you, rather than the standard geography split.