
Remote Sensing Technology MarketSize, Share & Industry Analysis, 2026-2034By TechnologyBy PlatformBy Sensor TypeBy OfferingBy ApplicationBy End UserBy ResolutionBy Spectral BandBy Data Delivery ModelBy Orbit Type
Full title & scope — all 10 axes with their segments
Remote Sensing Technology Market Size, Share & Industry Analysis, By Technology (Active Remote Sensing, Passive Remote Sensing), By Platform (Satellites, Unmanned Aerial Vehicles, Manned Aircraft, Ground-Based Systems, Marine Platforms), By Sensor Type (Optical Sensors, LiDAR Sensors, Synthetic Aperture Radar, Hyperspectral Sensors, Thermal Infrared Sensors, Multispectral Sensors), By Offering (Hardware, Software, Data and Imagery, Services), By Application (Agriculture and Forestry, Environmental Monitoring, Urban Planning and Infrastructure, Disaster Management, Defense and Intelligence, Oil, Gas and Mining, Transportation and Logistics, Weather Forecasting and Climate), By End User (Government, Military and Defense, Commercial Enterprises, Research Institutions), By Resolution (Low Resolution, Medium Resolution, High Resolution, Very High Resolution), By Spectral Band (Visible and Near-Infrared, Shortwave Infrared, Thermal Infrared, Microwave), By Data Delivery Model (Archive Data Purchase, Tasking on Demand, Subscription and Streaming, Analytics-as-a-Service), By Orbit Type (Low Earth Orbit, Medium Earth Orbit, Geostationary Orbit), and Regional Forecast, 2026-2034
Market outlook, key takeaways, drivers and challenges for the report period.
- 01By TechnologyActive Remote Sensing · Passive Remote Sensing
- 02By PlatformSatellites · Unmanned Aerial Vehicles · Manned Aircraft
- 03By Sensor TypeOptical Sensors · LiDAR Sensors · Synthetic Aperture Radar
- 04By OfferingHardware · Software · Data and Imagery
- 05By ApplicationAgriculture and Forestry · Environmental Monitoring · Urban Planning and Infrastructure
- 06By End UserGovernment · Military and Defense · Commercial Enterprises
- 07By ResolutionLow Resolution · Medium Resolution · High Resolution
- 08By Spectral BandVisible and Near-Infrared · Shortwave Infrared · Thermal Infrared
- 09By Data Delivery ModelArchive Data Purchase · Tasking on Demand · Subscription and Streaming
- 10By Orbit TypeLow Earth Orbit · Medium Earth Orbit · Geostationary Orbit
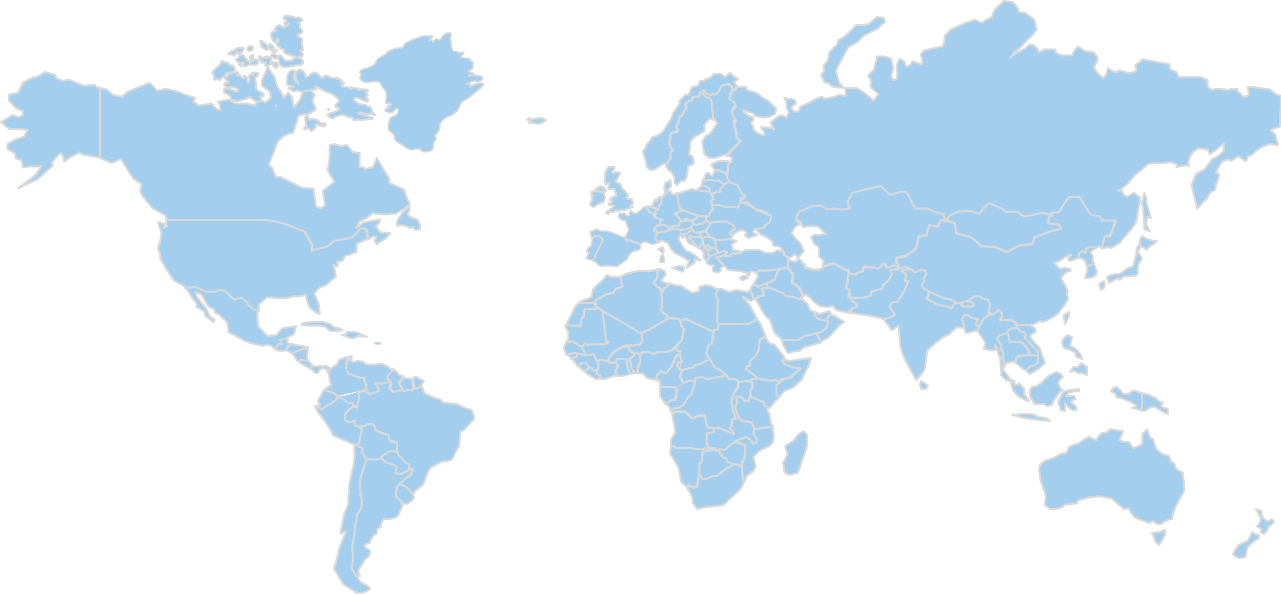
- 11By Region
Market Analysis & Outlook
Remote sensing technology covers the sensors, platforms, software and data used to observe the Earth's surface and atmosphere without physical contact. It takes the form of satellite, airborne, drone, ground-based and marine systems that capture optical, radar, laser, thermal and spectral measurements, together with the imagery and analytics produced from them. Buyers include government mapping and space agencies, defence and intelligence organisations, and commercial users in agriculture, energy, mining, insurance and infrastructure.
Between 2025 and 2034 the global remote sensing technology market moves from USD 19 billion to USD 45.8 billion, compounding at 10.24% a year. Fifteen years are covered in all, taking in USD 12.35 billion in 2020, USD 17.5 billion in 2024, USD 21 billion in 2026 and USD 31.2 billion in 2030.
On the technology axis, growth rates run from 8.49% for Passive Remote Sensing up to 12.46% for Active Remote Sensing. Passive Remote Sensing carries the volume: USD 11.4 billion and 60% of revenue in 2025, USD 23.82 billion and 52.01% in 2034. The lines gaining share are Active Remote Sensing. Passive Remote Sensing lose share without losing revenue.
By platform, Satellites accounts for 40% of 2025 revenue at USD 7.6 billion, reaching USD 18.32 billion and 40% by 2034. Unmanned Aerial Vehicles grows faster at 13.04% against 10.27%, moving from 24% of revenue to 30% by 2034. This axis divides the same revenue as the technology split instead of adding to it, so the two are read together and never summed.
USD 7.03 billion of 2025 revenue is generated in North America, 37% of the global total and the largest regional share; it reaches USD 15.11 billion by 2034. Asia Pacific is next at 26% and USD 4.94 billion, and Latin America last at 5%. Because Asia Pacific take share, the revenue added by 2034 concentrates instead of spreading across all five regions.
Behind these figures sit five regions, two technology lines and ten segmentation axes, each reported for every year from 2020 to 2034. The headline 2025 value is arrived at by triangulating published aggregates against category proxies, not by an independent count, and the same applies to the segment, regional and country breakdowns drawn from it.
Market Size, 2020–2034
USD BillionRevenue in USD Billion. Values up to 2025 are actuals; 2026–2034 are forecast.
Key Takeaways
- The global remote sensing technology market moves from USD 12.35 billion in 2020 to USD 19 billion in 2025 and USD 45.8 billion by 2034, the forecast period compounding at 10.24% a year.
- The largest line by technology is Passive Remote Sensing, worth USD 11.4 billion and 60% of revenue in 2025, rising to USD 23.82 billion and 52.01% by 2034.
- At 12.46%, Active Remote Sensing grows faster than any other technology line, moving from USD 7.6 billion and 40% of revenue in 2025 to USD 21.98 billion and 47.99% in 2034.
- Scenario range for 2034 runs from USD 39.8 billion in the bear case to USD 52.5 billion in the bull case, against a base-case USD 45.8 billion, the spread a plan built on this forecast has to absorb.
- 37% of 2025 revenue is generated in North America, worth USD 7.03 billion and rising to USD 15.11 billion by 2034; Latin America is smallest at 5%.
- Within North America, the United States is the worked country example, at USD 6.05 billion in 2025; 86.06% of regional revenue in the base year, and USD 12.85 billion by 2034.
- The study covers 2020 through 2034 with 2025 as the base year, reporting five regions and ten segmentation axes separately, with revenue, share and a growth rate for every line in each year.
Market Trends
Revenue Share, By technology
Base year 2025Passive Remote Sensing leads with 60.0% of technology segment revenue.
Share of technology segment revenue, most recent base year.
Three things move over 2026-2034, and they are worth separating: the technology mix, the regional balance, and the 10.24% compounding underneath both.
None of them reverses the market's direction. Every line and every region grows in absolute terms across the period; the movement is in which of them captures the revenue added.
Active Remote Sensing grows faster than Passive Remote Sensing. Between 2026 and 2034, 12.46% growth in Active Remote Sensing against 8.49% in Passive Remote Sensing pulls the technology mix apart. Shares follow: 40% to 47.99% for Active Remote Sensing, 60% to 52.01% for Passive Remote Sensing. Revenue rises on both sides; USD 7.6 billion to USD 21.98 billion and USD 11.4 billion to USD 23.82 billion respectively, so this is a change in composition, not a contraction, and one forecast window is long enough for it to matter.
The regional balance moves. Asia Pacific moves from 26% of revenue in 2025 to 33% in 2034, worth USD 4.94 billion rising to USD 15.11 billion. The remaining regions grow in absolute terms while giving up share: North America at 37% moving to 33%, Europe at 24% moving to 22%, Latin America at 5% moving to 5%, Middle East and Africa at 8% moving to 7%. Growth is therefore not something a participant inherits from the market; it depends on which regions its revenue is weighted toward.
A continuation, not an inflection. Fifteen years of revenue run USD 12.35 billion in 2020, USD 17.5 billion in 2024, USD 19 billion in 2025, USD 21 billion in 2026, USD 31.2 billion in 2030 and USD 45.8 billion in 2034. The forecast rate of 10.24% sits against 9% over the historical period, so the projection extends an observed trend instead of proposing a new one. For a participant that makes planning a question of capturing a share of steady expansion instead of timing a discontinuity, and it is why the technology and regional mixes matter more to a forecast than the headline rate does.
Market Growth Factors
Active Remote Sensing adds the most incremental growth
Market Drivers
3- 01Active Remote Sensing adds the most incremental growth
At 12.46% against a market rate of 10.24%, Active Remote Sensing is the line pulling the average up: USD 7.6 billion to USD 21.98 billion, and 40% of revenue to 47.99%. Because the spread to Passive Remote Sensing at 8.49% is this wide, the headline 10.24% is a weighted result, not a rate any single line achieves. That makes position on the technology axis a growth decision, not a product one.
- 02The two largest regions hold most of the base
37% of 2025 revenue (USD 7.03 billion) is generated in North America, reaching USD 15.11 billion by 2034 at an unchanged 33%. Asia Pacific is next at 26% of revenue, USD 4.94 billion in 2025 and USD 15.11 billion in 2034. Because both the existing revenue and the revenue added concentrate in these two, regional weighting matters more to a forecast than regional count does.
- 03Fifteen years of unbroken growth underpin the forecast
The historical period compounded at 9%; USD 12.35 billion in 2020, USD 17.5 billion in 2024 and USD 19 billion in 2025. The forecast period then runs at 10.24%, ending 2034 at USD 45.8 billion. With the trajectory already demonstrated over fifteen years, what remains uncertain is the mix, not the direction, which is where the segment and regional sections do the work.
Growth drivers
| # | Growth driver | Impact | Gross contribution (USD Billion) | 2026-28 | 2029-31 | 2032-34 |
|---|---|---|---|---|---|---|
| 1 | Small-satellite constellations and lower launch costs | High | +9.6 | High | High | Medium |
| 2 | Defense and intelligence demand for persistent monitoring | Medium-High | +7.4 | High | Medium | Medium |
| 3 | Climate, agriculture and environmental compliance monitoring | Medium-High | +5.6 | Medium | High | High |
| 4 | Drone adoption in surveying and infrastructure inspection | Medium | +4.2 | High | Medium | Medium |
| 5 | AI analytics and cloud delivery lowering the cost per insight | Medium | +3 | Medium | High | High |
| 6 | Others | Low | +1.8 | Low | Low | Low |
| Total | +31.6 | |||||
Restraints
| # | Restraint | Impact | Estimated reduction (USD Billion) | 2026-28 | 2029-31 | 2032-34 |
|---|---|---|---|---|---|---|
| 1 | Export controls, spectrum and airspace regulation | Medium-High | −2.6 | High | Medium | Medium |
| 2 | High upfront cost of sensors and launch capacity | Medium | −1.4 | Medium | Medium | Low |
| 3 | Shortage of geospatial analysts and data-processing capacity | Low | −0.8 | Low | Low | Low |
| Total | −4.8 | |||||
Drivers contribute 31.6 USD Billion and restraints remove 4.8 USD Billion, a net 26.8 USD Billion, which is the revenue the market adds between the base year and 2034. Contributions are CDI estimates, apportioned so that they reconcile with the forecast rather than being read from it.
Growth in the global remote sensing technology market comes from three measurable sources over 2026-2034: the market's own compounding at 10.24%, the share gained by faster-growing technology lines, and expansion in the regions taking a larger part of global revenue.
Restraining Factors
What holds the forecast back
Market Restraints
2- 01What holds the forecast back
Export controls tighten, constellation launches slip, imagery prices fall faster than volumes rise, and public geospatial budgets stay flat in real terms. On that assumption 2034 revenue lands at USD 39.8 billion against the USD 45.8 billion base case, from the same USD 19 billion 2025 starting point.
- 02The largest line is not the fastest
Passive Remote Sensing carries 60% of 2025 revenue at USD 11.4 billion but compounds at 8.49% against 10.24% for the market, taking its share to 52.01% by 2034 even as revenue rises to USD 23.82 billion. Because it carries that much of the base, its pace holds the blended rate down more than any faster line lifts it.
Market Opportunities
What the bull case turns on
Market Opportunities
2- 01What the bull case turns on
A bull case of USD 52.5 billion by 2034, against USD 45.8 billion in the base case, turns on a single stated assumption: launch costs fall faster, planned constellations reach orbit on schedule, defence and civil budgets grow above inflation, and analytics subscriptions spread quickly among commercial buyers. The USD 19 billion 2025 base is common to both.
- 02Active Remote Sensing share moves from 40% to 47.99%
Share on the technology axis moves toward Active Remote Sensing, from 40% in 2025 to 47.99% in 2034, on 12.46% growth against the market's 10.24% and revenue rising from USD 7.6 billion to USD 21.98 billion. Taking position there does not require displacing whoever holds Passive Remote Sensing, which is the harder and more expensive fight.
Market Challenges
One technology line carries the market
Market Challenges
2- 01One technology line carries the market
USD 11.4 billion of 2025 revenue sits in Passive Remote Sensing, 60% of the total, and it is still 52.01% at USD 23.82 billion nine years later. That concentration means the market's own forecast is, to a large extent, a forecast for one technology line.
- 02Single-country exposure in North America
Of North America's USD 7.03 billion in 2025, USD 6.05 billion (86.06%) comes from the United States alone, rising to USD 12.85 billion by 2034. The consequence is that regional risk here is really country risk wearing a larger label.
Segmentation Analysis
10 axesThe global remote sensing technology market is cut ten ways: by technology, platform, sensor type, offering, application, end user, resolution, spectral band, data delivery model and orbit type. Every one of them divides the same revenue, which makes them views of one market from different commercial angles, not components of it.
All two technology lines expand in revenue terms over the forecast period. Share is the dividing line; one takes it, the other cedes it.
By Technology · 2 segments
Active Remote Sensing Outpaces the Axis While Passive Remote Sensing Holds the Largest Share
- Largest Passive Remote Sensing · 60%
- Fastest Active Remote Sensing · 12.5%
- Moves most Active Remote Sensing · +8 pts
- Order by 2034 unchanged
| Segment | 2025 | Share | 2034 | Share | CAGR |
|---|---|---|---|---|---|
| Active Remote Sensing | $7.60B | 40% | $21.98B | 48%+8 | 12.5% |
| Passive Remote Sensing | $11.40B | 60% | $23.82B | 52%-8 | 8.5% |
Passive sensing leads because optical and multispectral imaging underpin the largest installed base of satellites, aircraft and drones, and buyers across agriculture and mapping already rely on it. Active sensing grows fastest because radar and laser systems work through cloud and darkness, which suits defence, infrastructure and surveying buyers who need dependable revisit. Passive Remote Sensing remains the largest line through 2034, so the axis changes in proportion, not in order. This is the axis the estimation prices in full, year by year, and the one the regional chapters cut against.
By Platform · 5 segments
Satellites Held the Dominant Share of the Platform Segment in 2025
- Largest Satellites · 40%
- Fastest Unmanned Aerial Vehicles · 13%
- Moves most Unmanned Aerial Vehicles · +6 pts
- Order by 2034 unchanged
| Segment | 2025 | Share | 2034 | Share | CAGR |
|---|---|---|---|---|---|
| Satellites | $7.60B | 40% | $18.32B | 40% | 10.3% |
| Unmanned Aerial Vehicles | $4.56B | 24% | $13.74B | 30%+6 | 13% |
| Manned Aircraft | $3.04B | 16% | $5.50B | 12%-4 | 6.8% |
| Ground-Based Systems | $2.66B | 14% | $5.50B | 12%-2 | 8.4% |
| Marine Platforms | $1.14B | 6% | $2.74B | 6% | 10.2% |
Satellites lead because they give repeatable global coverage and anchor the large government and defence programmes that buy the most data. Unmanned aerial vehicles grow fastest as falling hardware prices and simpler regulation let surveyors, farms and utilities collect high-detail data on demand without the cost of crewed aircraft. Satellites remains the largest line through 2034, so the axis changes in proportion, not in order.
By Sensor Type · 6 segments
Hyperspectral Sensors Outpaces the Axis While Optical Sensors Holds the Largest Share
- Largest Optical Sensors · 28%
- Fastest Hyperspectral Sensors · 15.4%
- Moves most Optical Sensors · -6 pts
- Order by 2034 changes
| Segment | 2025 | Share | 2034 | Share | CAGR |
|---|---|---|---|---|---|
| Optical Sensors | $5.32B | 28% | $10.08B | 22%-6 | 7.4% |
| LiDAR Sensors | $3.42B | 18% | $10.08B | 22%+4 | 12.8% |
| Synthetic Aperture Radar | $2.66B | 14% | $9.16B | 20%+6 | 14.7% |
| Hyperspectral Sensors | $1.52B | 8% | $5.50B | 12%+4 | 15.4% |
| Thermal Infrared Sensors | $1.90B | 10% | $3.66B | 8%-2 | 7.6% |
| Multispectral Sensors | $4.18B | 22% | $7.32B | 16%-6 | 6.4% |
Optical sensors lead because they are the established workhorse of imaging and mapping, with the widest supplier base and the broadest range of uses. Hyperspectral sensors grow fastest as agriculture, mining and environmental buyers pay for material identification that standard imagery cannot provide, helped by smaller and cheaper instruments. The order does not change: Optical Sensors is still largest in 2034, and what moves is how much it holds.
By Offering · 4 segments
Hardware Held the Dominant Share of the Offering Segment in 2025
- Largest Hardware · 46%
- Fastest Software · 14.3%
- Moves most Hardware · -10 pts
- Order by 2034 unchanged
| Segment | 2025 | Share | 2034 | Share | CAGR |
|---|---|---|---|---|---|
| Hardware | $8.74B | 46% | $16.49B | 36%-10 | 7.3% |
| Software | $3.04B | 16% | $10.08B | 22%+6 | 14.3% |
| Data and Imagery | $4.18B | 22% | $11.90B | 26%+4 | 12.3% |
| Services | $3.04B | 16% | $7.33B | 16% | 10.3% |
Hardware leads because every collection programme begins with a purchase of sensors, platforms and ground equipment, and those contracts are large. Software grows fastest as buyers move from owning raw data to paying for processing, analytics and cloud tools that turn imagery into decisions. Hardware remains the largest line through 2034, so the axis changes in proportion, not in order.
By Application · 8 segments
By Application
- Largest Defense and Intelligence · 24%
- Fastest Urban Planning and Infrastructure · 12.2%
- Moves most Oil, Gas and Mining · -3 pts
- Order by 2034 changes
| Segment | 2025 | Share | 2034 | Share | CAGR |
|---|---|---|---|---|---|
| Agriculture and Forestry | $3.04B | 16% | $6.87B | 15%-1 | 9.5% |
| Environmental Monitoring | $2.47B | 13% | $6.41B | 14%+1 | 11.2% |
| Urban Planning and Infrastructure | $2.28B | 12% | $6.41B | 14%+2 | 12.2% |
| Disaster Management | $1.52B | 8% | $4.12B | 9%+1 | 11.7% |
| Defense and Intelligence | $4.56B | 24% | $11B | 24% | 10.3% |
| Oil, Gas and Mining | $2.09B | 11% | $3.66B | 8%-3 | 6.4% |
| Transportation and Logistics | $1.33B | 7% | $3.21B | 7% | 10.3% |
| Weather Forecasting and Climate | $1.71B | 9% | $4.12B | 9% | 10.3% |
2025 to 2034 revenue and share by line: Defense and Intelligence USD 4.56 billion to USD 11 billion (24% to 24%), Agriculture and Forestry USD 3.04 billion to USD 6.87 billion (16% to 15%), Environmental Monitoring USD 2.47 billion to USD 6.41 billion (13% to 14%), Urban Planning and Infrastructure USD 2.28 billion to USD 6.41 billion (12% to 14%), Oil, Gas and Mining USD 2.09 billion to USD 3.66 billion (11% to 8%), Weather Forecasting and Climate USD 1.71 billion to USD 4.12 billion (9% to 9%), Disaster Management USD 1.52 billion to USD 4.12 billion (8% to 9%), Transportation and Logistics USD 1.33 billion to USD 3.21 billion (7% to 7%). Defense and Intelligence Led by Application in 2025, with Urban Planning and Infrastructure Growing Fastest Defence and intelligence leads because persistent surveillance is funded by large, recurring government budgets and tolerates premium prices. Urban planning and infrastructure grows fastest as cities, utilities and transport operators adopt digital twins and regular change detection for asset management and permitting. Defense and Intelligence remains the largest line through 2034, so the axis changes in proportion, not in order.
By End User · 4 segments
Government Led by End user in 2025, with Commercial Enterprises Growing Fastest
- Largest Government · 34%
- Fastest Commercial Enterprises · 14.5%
- Moves most Commercial Enterprises · +12 pts
- Order by 2034 changes
| Segment | 2025 | Share | 2034 | Share | CAGR |
|---|---|---|---|---|---|
| Government | $6.46B | 34% | $12.82B | 28%-6 | 7.9% |
| Military and Defense | $4.94B | 26% | $10.08B | 22%-4 | 8.3% |
| Commercial Enterprises | $5.70B | 30% | $19.24B | 42%+12 | 14.5% |
| Research Institutions | $1.90B | 10% | $3.66B | 8%-2 | 7.6% |
Government leads because national mapping, civil monitoring and space agencies are the longest-standing and largest buyers of data and systems. Commercial enterprises grow fastest as insurers, energy firms, agribusinesses and financial analysts buy imagery and analytics through subscriptions instead of building their own collection capability. Leadership changes hands: Commercial Enterprises is the largest line by 2034, not Government.
By Resolution · 4 segments
Scale in High Resolution and Growth in Very High Resolution Define the Resolution Axis
- Largest High Resolution · 38%
- Fastest Very High Resolution · 16.5%
- Moves most Very High Resolution · +14 pts
- Order by 2034 changes
| Segment | 2025 | Share | 2034 | Share | CAGR |
|---|---|---|---|---|---|
| Low Resolution | $2.28B | 12% | $2.75B | 6%-6 | 2.1% |
| Medium Resolution | $5.32B | 28% | $9.16B | 20%-8 | 6.2% |
| High Resolution | $7.22B | 38% | $17.40B | 38% | 10.3% |
| Very High Resolution | $4.18B | 22% | $16.49B | 36%+14 | 16.5% |
High resolution leads because it balances detail and coverage for mapping, agriculture and infrastructure work, the bulk of paid demand. Very high resolution grows fastest as defence and urban buyers pay a premium for object-level detail, and new constellations and drones are making it cheaper to collect. High Resolution remains the largest line through 2034, so the axis changes in proportion, not in order.
By Spectral Band · 4 segments
Microwave Outpaces the Axis While Visible and Near-Infrared Holds the Largest Share
- Largest Visible and Near-Infrared · 42%
- Fastest Microwave · 13.3%
- Moves most Microwave · +9 pts
- Order by 2034 changes
| Segment | 2025 | Share | 2034 | Share | CAGR |
|---|---|---|---|---|---|
| Visible and Near-Infrared | $7.98B | 42% | $15.57B | 34%-8 | 7.7% |
| Shortwave Infrared | $2.66B | 14% | $7.33B | 16%+2 | 11.9% |
| Thermal Infrared | $2.28B | 12% | $4.12B | 9%-3 | 6.8% |
| Microwave | $6.08B | 32% | $18.78B | 41%+9 | 13.3% |
Visible and near-infrared leads because it matches the sensors most platforms already carry and serves the widest range of mapping and vegetation uses. Microwave grows fastest as radar delivers imagery through cloud cover and at night, which monitoring and security customers need on a fixed schedule. Leadership changes hands: Microwave is the largest line by 2034, not Visible and Near-Infrared.
By Data Delivery Model · 4 segments
Archive Data Purchase Held the Dominant Share of the Data delivery model Segment in 2025
- Largest Archive Data Purchase · 30%
- Fastest Analytics-as-a-Service · 16.7%
- Moves most Archive Data Purchase · -12 pts
- Order by 2034 changes
| Segment | 2025 | Share | 2034 | Share | CAGR |
|---|---|---|---|---|---|
| Archive Data Purchase | $5.70B | 30% | $8.24B | 18%-12 | 4.2% |
| Tasking on Demand | $4.56B | 24% | $9.16B | 20%-4 | 8.1% |
| Subscription and Streaming | $5.32B | 28% | $14.66B | 32%+4 | 11.9% |
| Analytics-as-a-Service | $3.42B | 18% | $13.74B | 30%+12 | 16.7% |
Subscription and streaming leads among the delivery routes with recurring revenue because buyers prefer predictable access to fresh data over single scene purchases. Analytics-as-a-service grows fastest as customers without in-house geospatial teams pay for finished answers such as crop condition or site change alerts. Leadership changes hands: Subscription and Streaming is the largest line by 2034, not Archive Data Purchase.
By Orbit Type · 4 segments
Non-Orbital Led by Orbit type in 2025, with Low Earth Orbit Growing Fastest
- Largest Non-Orbital (Airborne, Ground-Based and Marine) · 60%
- Fastest Low Earth Orbit · 12.6%
- Moves most Low Earth Orbit · +5 pts
- Order by 2034 unchanged
| Segment | 2025 | Share | 2034 | Share | CAGR |
|---|---|---|---|---|---|
| Low Earth Orbit | $4.56B | 24% | $13.29B | 29%+5 | 12.6% |
| Medium Earth Orbit | $0.57B | 3% | $1.37B | 3% | 10.2% |
| Geostationary Orbit | $2.47B | 13% | $3.66B | 8%-5 | 4.5% |
| Non-Orbital (Airborne, Ground-Based and Marine) | $11.40B | 60% | $27.48B | 60% | 10.3% |
Non-orbital platforms such as aircraft, drones and ground systems are shown as a fourth line so the axis covers the whole market and not only satellite revenue. Low Earth orbit leads among satellites because small, frequently revisiting constellations dominate new launches. Its growth outpaces medium and geostationary orbit, which serve fewer and older programmes. The fastest line is Low Earth Orbit, which is why the split shifts toward it over the period. The order does not change: Non-Orbital is still largest in 2034, and what moves is how much it holds.
Regional Insights
Regional Revenue Share
Base year 2025Share of global revenue in the base year.
Only the leading region's share is published outside the report; pins mark the region, not a specific country.
North America Market Analysis
The largest region covered — 4 points of share move elsewhere by 2034, while revenue still grows 2.1×.
- Rank 1 of 5
- 2025 share 37%
- By 2034 33%
- Revenue $7.03B → $15.11B
USD 7.03 billion of 2025 revenue is generated in North America, 37% of the global remote sensing technology market on the way to USD 15.11 billion by 2034. It is a dominant region on this axis, first by revenue throughout the period.
By 2034 the share stands at 33%, though revenue still rises throughout; the shift is in the region's weight against faster-growing ones, which is not the same as weakening demand.
Passive Remote Sensing leads here as it does globally, at 60% of 2025 revenue, and Active Remote Sensing again grows fastest at 12.46%. North America is reported axis by axis and country by country in the full study.
United States
Sets the pace for North America at 86.1% of it, growing 2.1×.
- In region 1 of 2
- Of region 86.1%
- Of global 31.8%
- Revenue $6.05B → $12.85B
USD 6.05 billion of North America's 2025 revenue is generated in the United States, the region's largest market, reaching USD 12.85 billion by 2034. At 86.06% of regional revenue in the base year it is not one market among several, the region's trajectory is largely this country's trajectory. Set against USD 7.03 billion and USD 15.11 billion for the region, it is why this market, and not a smaller one, is the one reported in full.
Demand in the United States follows the technology mix reported at global level: Passive Remote Sensing is the largest line at 60% of 2025 revenue, moving to 52.01% by 2034, while Active Remote Sensing grows fastest at 12.46% and takes its share from 40% to 47.99%. Its 86.06% weight in North America means those movements carry straight into the regional totals. The full report reports the United States by technology separately.
Remote sensing technology in the United States is governed by several bodies depending on the platform. Commercial satellite imaging operators need a licence from the National Oceanic and Atmospheric Administration under its commercial remote sensing licensing regime, and the Federal Communications Commission authorizes the radio links and spectrum these systems use. Airborne and drone-mounted sensors fall under the Federal Aviation Administration's rules for aircraft and unmanned systems. Suppliers of laser-based instruments must also meet the Food and Drug Administration's laser product performance and labelling requirements. Export of high-resolution sensors and related data is controlled through the Department of Commerce and the Department of State, so a supplier usually screens each shipment against these control lists before it ships.
Maxar Technologies, Planet Labs PBC, Airbus SE, Hexagon AB, Teledyne Technologies Incorporated, Trimble Inc., L3Harris Technologies, Inc., Lockheed Martin Corporation, Northrop Grumman Corporation, Thales Group, BlackSky Technology Inc., ICEYE Ltd., Capella Space Corp., Satellogic Inc., Spire Global, Inc., Leonardo S.p.A., Velodyne Lidar / Ouster, Inc., Teledyne FLIR LLC, Headwall Photonics, Inc., Specim, Spectral Imaging Ltd., Garmin Ltd., RIEGL Laser Measurement Systems GmbH, Topcon Corporation, DJI, Esri Inc., Harris Geospatial Solutions (NV5 Global, Inc.), Geoscan Group, SuperMap Software Co., Ltd., Geosystems (Leica Geosystems AG), Terra Bella / Skybox (Planet), Orbital Insight, Hisdesat Servicios Estratégicos S.A., Surrey Satellite Technology Ltd. and Bharat Electronics Limited are the suppliers covered in the United States. Passive Remote Sensing, at 60% of 2025 revenue, is where the volume sits, and Active Remote Sensing, growing at 12.46%, is where position changes hands over the forecast period. Country-level positioning and shares for each of these companies are part of the full report, not of this summary.
Canada
2nd-largest in North America, growing 2.2×.
- In region 2 of 2
- Of region 10%
- Of global 3.7%
- Revenue $0.70B → $1.55B
Canada is sized at USD 0.7 billion in 2025, rising to USD 1.55 billion by 2034; 3.68% of global revenue and 9.96% of North America. It is reported separately from the United States across every segmentation axis in the full report.
Europe Market Analysis
The 3rd-largest region covered — 2 points of share move elsewhere by 2034, while revenue still grows 2.2×.
- Rank 3 of 5
- 2025 share 24%
- By 2034 22%
- Revenue $4.56B → $10.08B
Europe holds 24% of the global remote sensing technology market in 2025, worth USD 4.56 billion with USD 10.08 billion projected for 2034. That makes it the third-largest region covered, in 2025 and again in 2034.
By 2034 the share stands at 22%, and the region keeps growing in absolute terms while others expand faster, a change in relative weight, not a decline in demand.
The technology mix reported at global level applies here, with Passive Remote Sensing the largest line at 60% of 2025 revenue and Active Remote Sensing the fastest-growing at 12.46%. Europe is reported axis by axis and country by country in the full study.
Germany
The largest market in Europe, growing 2.1×.
- In region 1 of 3
- Of region 21.9%
- Of global 5.3%
- Revenue $1B → $2.10B
The largest single market in Europe is Germany, at USD 1 billion in 2025 and USD 2.1 billion in 2034. 21.93% of the region in the base year makes it the largest market here without making it the region. Regional revenue of USD 4.56 billion in 2025 and USD 10.08 billion in 2034 sits around it, and it is the country used wherever the full report cuts a figure by geography.
Composition here matches the global split: the largest line is Passive Remote Sensing at 60% of 2025 revenue, easing to 52.01% by 2034, and the fastest is Active Remote Sensing at 12.46%, from 40% to 47.99%. Since 21.93% of Europe's revenue is generated here, the regional numbers inherit this market's mix instead of smoothing it out. Germany carries its own technology breakdown in the full report.
In Germany, remote sensing technology is regulated through a mix of national and European frameworks. Satellite data providers with high-grade earth observation systems fall under the German Satellite Data Security Act, which assigns oversight to the Federal Office for Information Security and the Federal Ministry for Economic Affairs and Climate Action. Sensor hardware sold on the market must carry the CE marking, which signals conformity with the EU Radio Equipment Directive, the Electromagnetic Compatibility Directive and the Low Voltage Directive. Laser-based instruments follow harmonised European laser safety standards. Drone-carried payloads are covered by the European Union Aviation Safety Agency regime, applied nationally by the Federal Aviation Office. Exporters of dual-use sensors need authorization from the Federal Office for Economic Affairs and Export Control.
In Germany the field is Maxar Technologies, Planet Labs PBC, Airbus SE, Hexagon AB, Teledyne Technologies Incorporated, Trimble Inc., L3Harris Technologies, Inc., Lockheed Martin Corporation, Northrop Grumman Corporation, Thales Group, BlackSky Technology Inc., ICEYE Ltd., Capella Space Corp., Satellogic Inc., Spire Global, Inc., Leonardo S.p.A., Velodyne Lidar / Ouster, Inc., Teledyne FLIR LLC, Headwall Photonics, Inc., Specim, Spectral Imaging Ltd., Garmin Ltd., RIEGL Laser Measurement Systems GmbH, Topcon Corporation, DJI, Esri Inc., Harris Geospatial Solutions (NV5 Global, Inc.), Geoscan Group, SuperMap Software Co., Ltd., Geosystems (Leica Geosystems AG), Terra Bella / Skybox (Planet), Orbital Insight, Hisdesat Servicios Estratégicos S.A., Surrey Satellite Technology Ltd. and Bharat Electronics Limited. Two different problems sit on the same axis: holding Passive Remote Sensing at 60% of 2025 revenue, and taking Active Remote Sensing while it grows at 12.46%. The commercial size of that position is USD 4.56 billion in 2025, moving to USD 10.08 billion by 2034 across the forecast period.
United Kingdom
2nd-largest in Europe, growing 2.1×.
- In region 2 of 3
- Of region 20.8%
- Of global 5%
- Revenue $0.95B → $1.95B
The United Kingdom is sized at USD 0.95 billion in 2025, rising to USD 1.95 billion by 2034; 5% of global revenue and 20.83% of Europe. It is reported separately from Germany across every segmentation axis in the full report.
France
3rd-largest in Europe, growing 2.0×.
- In region 3 of 3
- Of region 17.5%
- Of global 4.2%
- Revenue $0.80B → $1.60B
Within Europe, France accounts for 17.54% of regional revenue and 4.21% of the global total, worth USD 0.8 billion in 2025 and USD 1.6 billion by 2034.
Asia Pacific Market Analysis
The 2nd-largest region covered, and the one gaining the most — it picks up 7 points of share by 2034, while revenue still grows 3.1×.
- Rank 2 of 5
- 2025 share 26%
- By 2034 33%
- Revenue $4.94B → $15.11B
26% of the global remote sensing technology market sits in Asia Pacific in 2025, worth USD 4.94 billion rising to USD 15.11 billion in 2034. By revenue it sits second across the study, and the ranking does not change between 2025 and 2034.
By 2034 the share has moved up to 33%, on growth above the market's own 10.24%, and with a bigger contribution to the revenue added over the period than the base-year figure suggests.
Within the region the technology split tracks the global one; 60% of 2025 revenue in Passive Remote Sensing, fastest growth of 12.46% in Active Remote Sensing. Asia Pacific is reported axis by axis and country by country in the full study.
China
The largest market in Asia Pacific, growing 3.0×.
- In region 1 of 3
- Of region 35.4%
- Of global 9.2%
- Revenue $1.75B → $5.30B
The largest single market in Asia Pacific is China, at USD 1.75 billion in 2025 and USD 5.3 billion in 2034. 35.43% of the region in the base year makes it the largest market here without making it the region. Set against USD 4.94 billion and USD 15.11 billion for the region, it is why this market, and not a smaller one, is the one reported in full.
The technology pattern in China is the global one: 60% of 2025 revenue in Passive Remote Sensing, 52.01% by 2034, against 12.46% growth in Active Remote Sensing taking it from 40% to 47.99%. Because the country carries 35.43% of Asia Pacific, a movement in its own mix shows up in the regional totals instead of being averaged away by neighbouring markets. The full report reports China by technology separately.
China regulates remote sensing technology mainly through surveying, mapping and geographic information law. The Ministry of Natural Resources oversees satellite imagery and geospatial data, and holders of remote sensing data must follow rules on collection, storage, sharing and public release, with sensitive information subject to review. Foreign entities generally need approval and a Chinese partner for surveying activities. Radio frequency equipment is licensed by the Ministry of Industry and Information Technology, while the Civil Aviation Administration governs unmanned aircraft carrying sensors. Products that fall under the China Compulsory Certification scheme must obtain that mark before sale, and export of sensitive sensing equipment is controlled by the Ministry of Commerce. Data security and personal information laws also apply to imagery that identifies people or places.
Competition in China runs between the suppliers this study tracks: Maxar Technologies, Planet Labs PBC, Airbus SE, Hexagon AB, Teledyne Technologies Incorporated, Trimble Inc., L3Harris Technologies, Inc., Lockheed Martin Corporation, Northrop Grumman Corporation, Thales Group, BlackSky Technology Inc., ICEYE Ltd., Capella Space Corp., Satellogic Inc., Spire Global, Inc., Leonardo S.p.A., Velodyne Lidar / Ouster, Inc., Teledyne FLIR LLC, Headwall Photonics, Inc., Specim, Spectral Imaging Ltd., Garmin Ltd., RIEGL Laser Measurement Systems GmbH, Topcon Corporation, DJI, Esri Inc., Harris Geospatial Solutions (NV5 Global, Inc.), Geoscan Group, SuperMap Software Co., Ltd., Geosystems (Leica Geosystems AG), Terra Bella / Skybox (Planet), Orbital Insight, Hisdesat Servicios Estratégicos S.A., Surrey Satellite Technology Ltd. and Bharat Electronics Limited. Two different problems sit on the same axis: holding Passive Remote Sensing at 60% of 2025 revenue, and taking Active Remote Sensing while it grows at 12.46%. A supplier weighted toward Asia Pacific is competing over a base of USD 4.94 billion in 2025, reaching USD 15.11 billion by 2034 on the trajectory this study models.
India
2nd-largest in Asia Pacific, growing 3.7×.
- In region 2 of 3
- Of region 15.2%
- Of global 4%
- Revenue $0.75B → $2.80B
Within Asia Pacific, India accounts for 15.18% of regional revenue and 3.95% of the global total, worth USD 0.75 billion in 2025 and USD 2.8 billion by 2034.
Japan
3rd-largest in Asia Pacific, growing 2.3×.
- In region 3 of 3
- Of region 14.2%
- Of global 3.7%
- Revenue $0.70B → $1.60B
Within Asia Pacific, Japan accounts for 14.17% of regional revenue and 3.68% of the global total, worth USD 0.7 billion in 2025 and USD 1.6 billion by 2034.
Latin America Market Analysis
The 5th-largest region covered, holding its share flat through 2034, while revenue still grows 2.4×.
- Rank 5 of 5
- 2025 share 5%
- By 2034 5%
- Revenue $0.95B → $2.29B
USD 0.95 billion of 2025 revenue is generated in Latin America, 5% of the global remote sensing technology market rising to USD 2.29 billion in 2034. Among the five regions it ranks fifth by revenue in both years.
Share settles at 5% in 2034, while nothing contracts here; other regions simply grow faster, which shows up as relative weight, not as falling revenue.
The technology mix reported at global level applies here, with Passive Remote Sensing the largest line at 60% of 2025 revenue and Active Remote Sensing the fastest-growing at 12.46%. Revenue for Latin America is broken out by every segmentation axis and by country in the full report.
Brazil
The largest market in Latin America, growing 2.5×.
- In region 1 of 2
- Of region 42.1%
- Of global 2.1%
- Revenue $0.40B → $1B
USD 0.4 billion of Latin America's 2025 revenue is generated in Brazil, the region's largest market, reaching USD 1 billion by 2034. It accounts for 42.11% of regional revenue in the base year, the largest single share without dominating the region outright. The region itself runs USD 0.95 billion to USD 2.29 billion over the same period, and this is the market carrying the country-level detail in the full report.
The technology pattern in Brazil is the global one: 60% of 2025 revenue in Passive Remote Sensing, 52.01% by 2034, against 12.46% growth in Active Remote Sensing taking it from 40% to 47.99%. Because the country carries 42.11% of Latin America, a movement in its own mix shows up in the regional totals instead of being averaged away by neighbouring markets. The full report reports Brazil by technology separately.
In Brazil, remote sensing technology is overseen by several agencies with distinct roles. The National Telecommunications Agency, known as Anatel, certifies radio and wireless equipment before it can be sold, and sensor devices that transmit signals follow its homologation procedure. Unmanned aircraft carrying sensors are regulated by the National Civil Aviation Agency, together with the Department of Airspace Control, which handles flight authorization. The Brazilian Space Agency and the National Institute for Space Research shape policy and data access for earth observation, and much of the public satellite archive is openly distributed. Imports pass through customs and are subject to technical conformity rules set by the national metrology body, Inmetro, where the product category requires it. Personal data in imagery falls under the General Data Protection Law.
Maxar Technologies, Planet Labs PBC, Airbus SE, Hexagon AB, Teledyne Technologies Incorporated, Trimble Inc., L3Harris Technologies, Inc., Lockheed Martin Corporation, Northrop Grumman Corporation, Thales Group, BlackSky Technology Inc., ICEYE Ltd., Capella Space Corp., Satellogic Inc., Spire Global, Inc., Leonardo S.p.A., Velodyne Lidar / Ouster, Inc., Teledyne FLIR LLC, Headwall Photonics, Inc., Specim, Spectral Imaging Ltd., Garmin Ltd., RIEGL Laser Measurement Systems GmbH, Topcon Corporation, DJI, Esri Inc., Harris Geospatial Solutions (NV5 Global, Inc.), Geoscan Group, SuperMap Software Co., Ltd., Geosystems (Leica Geosystems AG), Terra Bella / Skybox (Planet), Orbital Insight, Hisdesat Servicios Estratégicos S.A., Surrey Satellite Technology Ltd. and Bharat Electronics Limited are the suppliers covered in Brazil. Volume sits in Passive Remote Sensing at 60% of 2025 revenue; movement sits in Active Remote Sensing at 12.46% growth. The commercial size of that position is USD 0.95 billion in 2025 and USD 2.29 billion by 2034, 5% of the global total in the base year.
Mexico
2nd-largest in Latin America, growing 2.5×.
- In region 2 of 2
- Of region 21.1%
- Of global 1.1%
- Revenue $0.20B → $0.50B
1.05% of global revenue is generated in Mexico; USD 0.2 billion in 2025, reaching USD 0.5 billion in 2034, and 21.05% of Latin America.
Middle East and Africa Market Analysis
The 4th-largest region covered — 1 point of share move elsewhere by 2034, while revenue still grows 2.1×.
- Rank 4 of 5
- 2025 share 8%
- By 2034 7%
- Revenue $1.52B → $3.21B
USD 1.52 billion of 2025 revenue is generated in Middle East and Africa, 8% of the global remote sensing technology market with USD 3.21 billion projected for 2034. By revenue it sits fourth across the study, and the ranking does not change between 2025 and 2034.
By 2034 the share stands at 7%, and the region keeps growing in absolute terms while others expand faster, a change in relative weight, not a decline in demand.
Within the region the technology split tracks the global one; 60% of 2025 revenue in Passive Remote Sensing, fastest growth of 12.46% in Active Remote Sensing. The full report breaks Middle East and Africa out along every axis and by country.
Saudi Arabia
The largest market in Middle East and Africa, growing 2.7×.
- In region 1 of 3
- Of region 19.7%
- Of global 1.6%
- Revenue $0.30B → $0.80B
Saudi Arabia is the largest market within Middle East and Africa, generating USD 0.3 billion in 2025 and projected to reach USD 0.8 billion by 2034. Its 19.74% of base-year regional revenue leads the region, though enough sits elsewhere that Middle East and Africa is not a proxy for it. Set against USD 1.52 billion and USD 3.21 billion for the region, it is why this market, and not a smaller one, is the one reported in full.
Saudi Arabia buys along the same lines as the market globally; Passive Remote Sensing first at 60% of 2025 revenue and 52.01% in 2034, Active Remote Sensing fastest at 12.46% on a share moving from 40% to 47.99%. With 19.74% of Middle East and Africa concentrated here, a change in this country's mix is visible in the regional figures instead of being diluted by its neighbours. Saudi Arabia carries its own technology breakdown in the full report.
Saudi Arabia governs remote sensing technology through its space, communications and aviation authorities. The Saudi Space Agency oversees space activities, including earth observation operators and satellite data use. The Communications, Space and Technology Commission licenses radio equipment and spectrum, and imported devices must be type-approved before sale. The General Authority for Civil Aviation regulates drones and requires registration and operating permits for payloads that capture imagery. The Saudi Standards, Metrology and Quality Organization sets conformity requirements, and many imported products must show a certificate of conformity through its conformity assessment programme. The General Authority for Survey and Geospatial Information controls mapping and geospatial data, so suppliers collecting or distributing location data usually need its authorization. Data protection rules also apply to imagery involving individuals.
Maxar Technologies, Planet Labs PBC, Airbus SE, Hexagon AB, Teledyne Technologies Incorporated, Trimble Inc., L3Harris Technologies, Inc., Lockheed Martin Corporation, Northrop Grumman Corporation, Thales Group, BlackSky Technology Inc., ICEYE Ltd., Capella Space Corp., Satellogic Inc., Spire Global, Inc., Leonardo S.p.A., Velodyne Lidar / Ouster, Inc., Teledyne FLIR LLC, Headwall Photonics, Inc., Specim, Spectral Imaging Ltd., Garmin Ltd., RIEGL Laser Measurement Systems GmbH, Topcon Corporation, DJI, Esri Inc., Harris Geospatial Solutions (NV5 Global, Inc.), Geoscan Group, SuperMap Software Co., Ltd., Geosystems (Leica Geosystems AG), Terra Bella / Skybox (Planet), Orbital Insight, Hisdesat Servicios Estratégicos S.A., Surrey Satellite Technology Ltd. and Bharat Electronics Limited are the suppliers covered in Saudi Arabia. Two different problems sit on the same axis: holding Passive Remote Sensing at 60% of 2025 revenue, and taking Active Remote Sensing while it grows at 12.46%. A supplier weighted toward Middle East and Africa is competing over a base of USD 1.52 billion in 2025 reaching USD 3.21 billion by 2034, 8% of global revenue at the start of that period.
United Arab Emirates
2nd-largest in Middle East and Africa, growing 2.7×.
- In region 2 of 3
- Of region 14.5%
- Of global 1.2%
- Revenue $0.22B → $0.60B
The United Arab Emirates is sized at USD 0.22 billion in 2025, rising to USD 0.6 billion by 2034; 1.16% of global revenue and 14.47% of Middle East and Africa. It is reported separately from Saudi Arabia across every segmentation axis in the full report.
South Africa
3rd-largest in Middle East and Africa, growing 2.2×.
- In region 3 of 3
- Of region 11.8%
- Of global 0.9%
- Revenue $0.18B → $0.40B
Within Middle East and Africa, South Africa accounts for 11.84% of regional revenue and 0.95% of the global total, worth USD 0.18 billion in 2025 and USD 0.4 billion by 2034.
Download a free sample to see the full data tables and segment-level detail behind this analysis.
Report Coverage
This report assesses the market across every segment, with revenue and a growth rate for each line in each year of the study period. It covers the drivers, trends, opportunities, restraints and challenges shaping growth, the competitive landscape and the companies profiled, and the research methodology behind every estimate. Segmentation is reported by technology, platform, sensor type, offering, application, end user, resolution, spectral band, data delivery model, orbit type, and regional analysis covers North America, Europe, Asia Pacific, Latin America, Middle East and Africa, each broken out by country.
Competitive Landscape
Position on the Technology Axis Decides Competitive Standing
Suppliers in scope: Maxar Technologies, Planet Labs PBC, Airbus SE, Hexagon AB, Teledyne Technologies Incorporated, Trimble Inc., L3Harris Technologies, Inc., Lockheed Martin Corporation, Northrop Grumman Corporation, Thales Group, BlackSky Technology Inc., ICEYE Ltd., Capella Space Corp., Satellogic Inc., Spire Global, Inc., Leonardo S.p.A., Velodyne Lidar / Ouster, Inc., Teledyne FLIR LLC, Headwall Photonics, Inc., Specim, Spectral Imaging Ltd., Garmin Ltd., RIEGL Laser Measurement Systems GmbH, Topcon Corporation, DJI, Esri Inc., Harris Geospatial Solutions (NV5 Global, Inc.), Geoscan Group, SuperMap Software Co., Ltd., Geosystems (Leica Geosystems AG), Terra Bella / Skybox (Planet), Orbital Insight, Hisdesat Servicios Estratégicos S.A., Surrey Satellite Technology Ltd. and Bharat Electronics Limited.
The technology axis, not the regional one, is where competition happens. 60% of 2025 revenue, worth USD 11.4 billion, is in Passive Remote Sensing, still 52.01% of the total in 2034; that is the position least likely to change hands. Share moves in Active Remote Sensing, growing 12.46% against 8.49% for Passive Remote Sensing. Holding the first and taking the second are separate capabilities, which is why a market of USD 19 billion supports as many suppliers as it does.
Suppliers separate on the ownership or access they hold to collection capacity, whether satellites, aircraft or sensors, and on how quickly they can revisit a site. The largest players hold advantages in sensor manufacturing scale, long government contracts, export-licence experience and integrated data pipelines that carry imagery through to analytics. Smaller and regional firms compete on specialised sensors, niche applications, local data sovereignty, faster tasking and lower prices for a single use case. Software and analytics providers win on workflow integration and ease of use, while hardware makers depend on reliability, calibration quality and after-sales support in demanding field conditions.
Geographic reach is the other axis of competition. North America alone accounts for 37% of 2025 revenue, so a supplier absent there is absent from the largest part of the market whatever its position elsewhere; Asia Pacific adds a further 26%.
The full report carries a profile, financials, share and development history for each company named; none of that is in this summary.
List of Key Remote Sensing Technology Market Companies Profiled
34 companies profiled. Company profiles, including financials, product portfolios and recent developments, are part of the full report.
- Maxar Technologies(United States)
- Planet Labs PBC(United States)
- Airbus SE(France)
- Hexagon AB(Sweden)
- Teledyne Technologies Incorporated(United States)
- Trimble Inc.(United States)
- L3Harris Technologies, Inc.(United States)
- Lockheed Martin Corporation(United States)
- Northrop Grumman Corporation(United States)
- Thales Group(France)
- BlackSky Technology Inc.(United States)
- ICEYE Ltd.(Finland)
- Capella Space Corp.(United States)
- Satellogic Inc.
- Spire Global, Inc.(United States)
- Leonardo S.p.A.(Italy)
- Velodyne Lidar / Ouster, Inc.(United States)
- Teledyne FLIR LLC(United States)
- Headwall Photonics, Inc.(United States)
- Specim, Spectral Imaging Ltd.(Finland)
- Garmin Ltd.(Switzerland)
- RIEGL Laser Measurement Systems GmbH(Austria)
- Topcon Corporation(Japan)
- DJI(China)
- Esri Inc.(United States)
- Harris Geospatial Solutions (NV5 Global, Inc.)(United States)
- Geoscan Group(Russia)
- SuperMap Software Co., Ltd.(China)
- Geosystems (Leica Geosystems AG)(Switzerland)
- Terra Bella / Skybox (Planet)(United States)
- Orbital Insight(United States)
- Hisdesat Servicios Estratégicos S.A.(Spain)
- Surrey Satellite Technology Ltd.(United Kingdom)
- Bharat Electronics Limited(India)
Geographic Coverage
Every market below is broken out separately in the report.
North America
3Europe
8Asia Pacific
12Latin America
3Middle East and Africa
4Key Insights
Report Scope
Study parameters & segmentationThis study covers market size and forecasts over the 2020–2034 period, segmentation across 10 axes (Technology, Platform, Sensor Type, Offering, Application, End User, Resolution, Spectral Band, Data Delivery Model, Orbit Type), regional analysis for 5 regions and their constituent countries, a competitive landscape profiling 34 key companies, and the research methodology behind every estimate.
Segmentation
10 axes + regionQuestions This Report Answers
6 questionsWhat is the market size and growth rate, globally and by region?
How is the market segmented, and which segments lead?
Which regions and countries are covered, and how do they compare?
What are the key drivers, restraints, opportunities and challenges?
Who are the leading companies operating in this market?
What trends are expected to shape the market through the forecast period?
Frequently Asked Questions
01What is the Remote Sensing Technology Market projected to reach?
USD 45.8 USD Billion by 2034, CAGR 10.24%
02What years does this report cover?
Study period 2020–2034, base year 2025, historical data 2020-2024, forecast period 2026-2034.
03Which regions are covered?
North America, Europe, Asia Pacific, Latin America, Middle East and Africa.
04Which region accounted for the largest market share?
North America leads with 37% of global revenue through 2034.
05Which segment leads the market?
Passive Remote Sensing is the largest line by technology, at 60% of revenue in 2025.
06Who are the key companies profiled?
Maxar Technologies, Planet Labs PBC, Airbus SE, Hexagon AB, Teledyne Technologies Incorporated, Trimble Inc., L3Harris Technologies, Inc., Lockheed Martin Corporation, Northrop Grumman Corporation, Thales Group, BlackSky Technology Inc., ICEYE Ltd., Capella Space Corp., Satellogic Inc., Spire Global, Inc., Leonardo S.p.A., Velodyne Lidar / Ouster, Inc., Teledyne FLIR LLC, Headwall Photonics, Inc., Specim, Spectral Imaging Ltd., Garmin Ltd., RIEGL Laser Measurement Systems GmbH, Topcon Corporation, DJI, Esri Inc., Harris Geospatial Solutions (NV5 Global, Inc.), Geoscan Group, SuperMap Software Co., Ltd., Geosystems (Leica Geosystems AG), Terra Bella / Skybox (Planet), Orbital Insight, Hisdesat Servicios Estratégicos S.A., Surrey Satellite Technology Ltd., Bharat Electronics Limited. Full profiles are part of the paid report.
07Can the segmentation be customized?
Yes. Custom data cuts by geography, segment, or competitor set are available on request.
Why choose CDI
Need this report shaped around your question?
The scope isn't fixed. Tell us what your team needs that the standard edition doesn't cover, and an analyst will come back on what can be adjusted and how long it takes, before you commit to anything.
Most licences include 30–60 hours of customization at no extra cost. See what each licence includes
Additional Companies
Add competitors, suppliers or the peer set you benchmark against to the companies already covered.
Deeper Competitive View
Sharpen the landscape work around your own position: product line, channel, or a named shortlist of rivals.
Extra Segment Splits
Break the market down along an axis the standard scope doesn't cut it by, or go a level deeper inside one.
Application Focus
Narrow the analysis to the specific use cases and end users your team actually sells into.
Different Time Frame
Move the base year, or widen the historical and forecast windows the study is built on.
Country-Level Detail
Go below region level into the individual countries that matter to you, rather than the standard geography split.