
Quantum Dots MarketSize, Share & Industry Analysis, 2026-2034By Material TypeBy Product FormBy Display ArchitectureBy Synthesis MethodBy ApplicationBy End-use IndustryBy Emission WavelengthBy Display SizeBy Shell and Surface ChemistryBy Sales Channel
Full title & scope — all 10 axes with their segments
Quantum Dots Market Size, Share & Industry Analysis, By Material Type (Cadmium-Based Quantum Dots, Cadmium-Free Quantum Dots, Perovskite Quantum Dots, Carbon and Graphene Quantum Dots, Silicon and Germanium Quantum Dots, Lead Chalcogenide Quantum Dots), By Product Form (Quantum Dot Film, Quantum Dot Ink, Quantum Dot Powder, Quantum Dot Solution/Dispersion, Quantum Dot Glass/Optical Plate, Quantum Dot Rail/Tube), By Display Architecture (Photoluminescent QD, QD Color Conversion Layer, Electroluminescent QD), By Synthesis Method (Colloidal Hot-Injection, Continuous Flow Synthesis, Heat-Up Synthesis, Top-Down Fabrication, Epitaxial Growth), By Application (Displays, Lighting, Photovoltaics and Solar Cells, Image Sensors and Photodetectors, Biomedical Imaging and Diagnostics, Lasers and Optoelectronics, Quantum Computing and Photonics), By End-use Industry (Consumer Electronics, Healthcare and Life Sciences, Automotive, Energy, Aerospace and Defense, Agriculture, Telecommunications), By Emission Wavelength (Red Emitting, Green Emitting, Blue Emitting, Near-Infrared and Short-Wave Infrared Emitting, Ultraviolet Emitting), By Display Size (Below 10 Inches, 10 to 32 Inches, 33 to 55 Inches, 56 to 75 Inches, Above 75 Inches), By Shell and Surface Chemistry (Core-Only, Core-Shell, Core-Multishell, Ligand-Engineered/Encapsulated), By Sales Channel (Direct Sales to Panel/Device Makers, Through Optical Film Converters, Distributors, Online Catalog Sales), and Regional Forecast, 2026-2034
Market outlook, key takeaways, drivers and challenges for the report period.
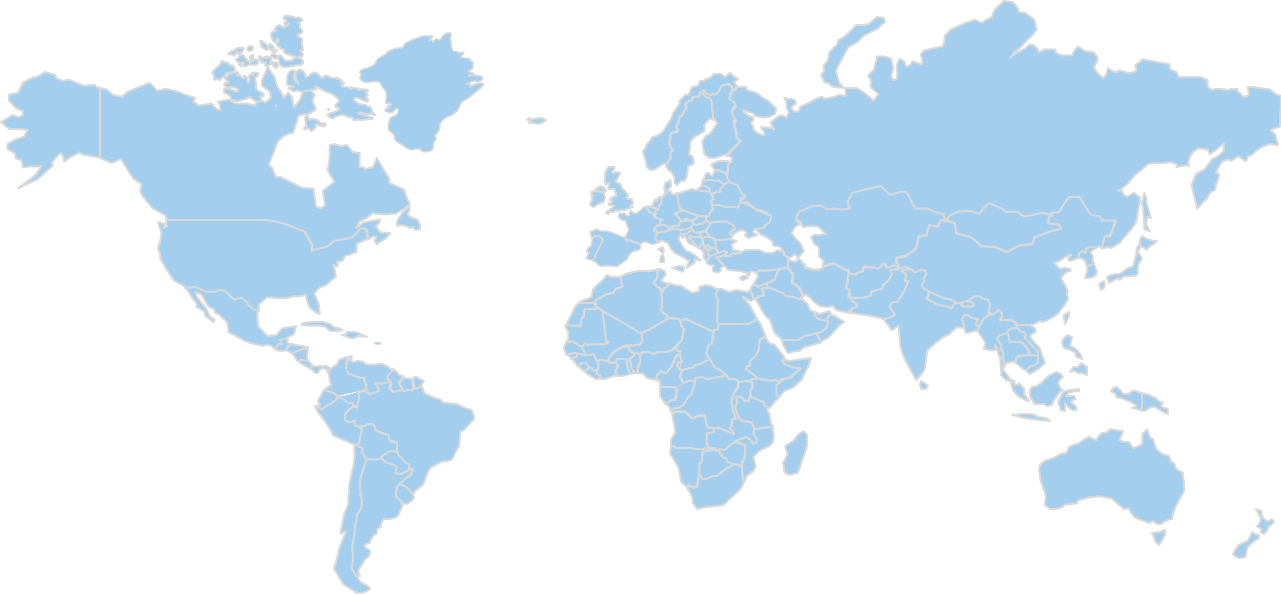
- 01By Material TypeCadmium-Based Quantum Dots · Cadmium-Free Quantum Dots · Perovskite Quantum Dots
- 02By Product FormQuantum Dot Film · Quantum Dot Ink · Quantum Dot Powder
- 03By Display ArchitecturePhotoluminescent QD · QD Color Conversion Layer · Electroluminescent QD
- 04By Synthesis MethodColloidal Hot-Injection · Continuous Flow Synthesis · Heat-Up Synthesis
- 05By ApplicationDisplays · Lighting · Photovoltaics and Solar Cells
- 06By End-use IndustryConsumer Electronics · Healthcare and Life Sciences · Automotive
- 07By Emission WavelengthRed Emitting · Green Emitting · Blue Emitting
- 08By Display SizeBelow 10 Inches · 10 to 32 Inches · 33 to 55 Inches
- 09By Shell and Surface ChemistryCore-Only · Core-Shell · Core-Multishell
- 10By Sales ChannelDirect Sales to Panel/Device Makers · Through Optical Film Converters · Distributors
- 11By Region
Market Analysis & Outlook
Quantum dots are semiconductor nanocrystals that emit light of a precise colour when excited, with the colour set by the crystal size. They are sold as film, ink, powder, solution, glass plate and tube, and in cadmium-based, cadmium-free, perovskite, carbon and other compositions. Buyers are display panel and television makers, film converters, sensor and lighting manufacturers, solar and photonics developers, and life science and research laboratories.
USD 9.5 billion of revenue was recorded in the global quantum dots market in 2025. By 2034 the figure reaches USD 27.85 billion, a compound annual growth rate of 12.5% through the forecast period, along a series that runs USD 4.6 billion in 2020, USD 8.35 billion in 2024, USD 10.85 billion in 2026 and USD 17.38 billion in 2030.
The material type mix shifts over the period. Cadmium-Based Quantum Dots is the largest line in 2025 at USD 3.61 billion, a 38% share, moving to USD 6.13 billion and 22% by 2034. Perovskite Quantum Dots grows fastest at 20.42%, taking its share from 9% to 17%, while Cadmium-Based Quantum Dots grows slowest at 5.71%. The lines gaining share are Cadmium-Free Quantum Dots, Perovskite Quantum Dots, Carbon and Graphene Quantum Dots and Silicon and Germanium Quantum Dots. Cadmium-Based Quantum Dots and Lead Chalcogenide Quantum Dots lose share without losing revenue.
Cut by product form, the largest line is Quantum Dot Film (QDEF): 46% of 2025 revenue, worth USD 4.37 billion, and 38% at USD 10.58 billion by 2034. Quantum Dot Ink grows faster at 19.53% against 10.33%, moving from 10% of revenue to 17% by 2034. Both this axis and the material type one divide the same revenue, which is why they are alternative views, not components.
Geographically, 47% of 2025 revenue sits in Asia Pacific (USD 4.47 billion rising to USD 13.93 billion) ahead of North America at 24% and USD 2.28 billion. Latin America is smallest, at 4%. Because Asia Pacific, Latin America and Middle East and Africa take share, the revenue added by 2034 concentrates instead of spreading across all five regions.
Behind these figures sit five regions, six material type lines and ten segmentation axes, each reported for every year from 2020 to 2034. The headline 2025 value is triangulated from published sources and category proxies, with no independently sourced count behind it, and the same applies to the segment, regional and country breakdowns drawn from it.
Market Size, 2020–2034
USD BillionRevenue in USD Billion. Values up to 2025 are actuals; 2026–2034 are forecast.
Key Takeaways
- The global quantum dots market moves from USD 4.6 billion in 2020 to USD 9.5 billion in 2025 and USD 27.85 billion by 2034, the forecast period compounding at 12.5% a year.
- Cadmium-Based Quantum Dots is the largest material type line at USD 3.61 billion in 2025, a 38% share, reaching USD 6.13 billion and 22% of revenue by 2034.
- Fastest growth on the material type axis belongs to Perovskite Quantum Dots: 20.42% a year, USD 0.86 billion to USD 4.73 billion, and a share moving from 9% to 17%.
- Against a base case of USD 27.85 billion in 2034, the study also reports a bear case at USD 19.8 billion and a bull case at USD 33.2 billion, with the assumptions behind each set out separately.
- The largest region is Asia Pacific, generating USD 4.47 billion in 2025 (47% of the global total) and USD 13.93 billion by 2034, ahead of North America at 24%.
- Within Asia Pacific, China is the worked country example, at USD 2.05 billion in 2025; 45.86% of regional revenue in the base year, and USD 6.9 billion by 2034.
- The study covers 2020 through 2034 with 2025 as the base year, reporting five regions and ten segmentation axes separately, with revenue, share and a growth rate for every line in each year.
Market Trends
Revenue Share, By material type
Base year 2025Cadmium-Based Quantum Dots leads with 38.0% of material type segment revenue.
Share of material type segment revenue, most recent base year.
Read across the forecast period, the global quantum dots market shows movement in three places: material type composition, regional weight, and the 12.5% rate applied to the whole.
The direction of the market is not in question in any of the three. Each line and each region grows in revenue terms; what separates them is which takes the larger part of the growth.
The material type mix tilts toward Perovskite Quantum Dots. 20.42% against 5.71%: that gap, between Perovskite Quantum Dots and Cadmium-Based Quantum Dots, is the largest on the material type axis. Over the forecast period that moves Perovskite Quantum Dots from 9% of revenue to 17%, and Cadmium-Based Quantum Dots from 38% to 22%. The revenue figures behind that are USD 0.86 billion to USD 4.73 billion and USD 3.61 billion to USD 6.13 billion. Both expand; where a supplier sits on the axis still decides whether it tracks the market.
Growth concentrates in Asia Pacific, Latin America and Middle East and Africa. Asia Pacific moves from 47% of revenue in 2025 to 50% in 2034, worth USD 4.47 billion rising to USD 13.93 billion; Latin America moves from 4% of revenue in 2025 to 4.5% in 2034, worth USD 0.38 billion rising to USD 1.25 billion; Middle East and Africa moves from 5% of revenue in 2025 to 5.5% in 2034, worth USD 0.47 billion rising to USD 1.53 billion. Share moves off the others in turn: North America at 24% moving to 22%, Europe at 20% moving to 18%, each still growing in revenue terms. The practical consequence is that regional weighting decides whether a participant matches the market rate or trails it, regardless of how its own revenue reads.
The series never breaks trajectory. Reading the series: USD 4.6 billion in 2020, USD 8.35 billion in 2024, USD 9.5 billion in 2025, USD 10.85 billion in 2026, USD 17.38 billion in 2030 and USD 27.85 billion in 2034. There is no discontinuity to time, and 12.5% forecast growth against 15.61% historical means the trend continues and does not turn. For a participant that makes planning a question of capturing a share of steady expansion instead of timing a discontinuity, and it is why the material type and regional mixes matter more to a forecast than the headline rate does.
Market Growth Factors
Growth is concentrated in Perovskite Quantum Dots
Market Drivers
3- 01Growth is concentrated in Perovskite Quantum Dots
Perovskite Quantum Dots compounds at 20.42% against 12.5% for the market, rising from USD 0.86 billion in 2025 to USD 4.73 billion in 2034 and from 9% of revenue to 17%. Nothing else on the axis grows as fast (Cadmium-Based Quantum Dots manages 5.71%) so the blended 12.5% is carried by this one line instead of shared across them. Exposure to this line, not to the market as a whole, is what determines a supplier's own rate.
- 02The two largest regions hold most of the base
The largest regional base is Asia Pacific: USD 4.47 billion in 2025 at 47% of the global total, USD 13.93 billion by 2034 and 50%. North America adds a further 24% at USD 2.28 billion, reaching USD 6.13 billion. Together the two account for the majority of both the 2025 base and the revenue added by 2034, which is why a regional plan treating all five regions at equal weight misreads where the growth actually lands.
- 03A demonstrated trajectory, not a projected turnaround
USD 4.6 billion in 2020, USD 8.35 billion in 2024 and USD 9.5 billion in 2025: 15.61% compound growth before the forecast period even begins. The forecast continues at 12.5% to USD 27.85 billion in 2034. Fifteen years of unbroken growth in the series means the forecast rests on a demonstrated trajectory, not a projected turnaround, and it is why the 12.5% rate is applied flat across the whole period instead of ramped through it.
Growth drivers
| # | Growth driver | Impact | Gross contribution (USD Billion) | 2026-28 | 2029-31 | 2032-34 |
|---|---|---|---|---|---|---|
| 1 | Rising adoption of quantum dot displays in televisions, monitors and tablets | High | +8 | High | High | Medium |
| 2 | Shift to cadmium-free and perovskite emitters under heavy-metal regulation | Medium-High | +5.6 | High | High | Medium |
| 3 | Expansion into image sensors, infrared detection, automotive and AR/VR displays | Medium-High | +3.4 | Medium | High | High |
| 4 | Lower cost per gram from continuous flow synthesis and process scale-up | Medium | +2.6 | Medium | Medium | Medium |
| 5 | Emerging use in biomedical imaging, solar layers and quantum photonics | Medium | +1.9 | Low | Medium | High |
| 6 | Others | Low | +1.45 | Low | Low | Low |
| Total | +22.95 | |||||
Restraints
| # | Restraint | Impact | Estimated reduction (USD Billion) | 2026-28 | 2029-31 | 2032-34 |
|---|---|---|---|---|---|---|
| 1 | Cadmium and heavy-metal restrictions that limit the use of mature emitters | Medium-High | −2.3 | High | Medium | Medium |
| 2 | Competition from OLED and MicroLED displays | Medium | −1.5 | Medium | Medium | High |
| 3 | Stability, efficiency and cost limits of blue and perovskite dots | Medium | −0.8 | Medium | Medium | Low |
| Total | −4.6 | |||||
Drivers contribute 22.95 USD Billion and restraints remove 4.6 USD Billion, a net 18.35 USD Billion, which is the revenue the market adds between the base year and 2034. Contributions are CDI estimates, apportioned so that they reconcile with the forecast rather than being read from it.
Separate the 12.5% into its parts and three show up: an already-large base compounding, the material type mix moving toward its faster lines, and regional growth landing unevenly.
Restraining Factors
Downside case: USD 19.8 billion by 2034, against USD 27.85 billion in the base case
Market Restraints
2- 01Downside case: USD 19.8 billion by 2034, against USD 27.85 billion in the base case
Where the forecast could miss: cadmium restrictions tighten before cadmium-free output can replace supply, OLED and MicroLED take large-format panel share faster, and blue and perovskite dots stay below commercial lifetime targets. That path reaches USD 19.8 billion by 2034 instead of USD 27.85 billion, off an unchanged USD 9.5 billion in 2025.
- 02The largest line is not the fastest
With 38% of 2025 revenue (USD 3.61 billion) Cadmium-Based Quantum Dots is where most of the market sits, and it grows at only 5.71% against the market's 12.5%. Revenue still reaches USD 6.13 billion by 2034 and share still falls to 22%: a drag on the average, not a decline.
Market Opportunities
What the bull case turns on
Market Opportunities
2- 01What the bull case turns on
A bull case of USD 33.2 billion by 2034, against USD 27.85 billion in the base case, turns on a single stated assumption: self-emissive QLED and printed colour conversion reach volume production earlier than assumed, perovskite and blue emitters reach commercial lifetimes, and infrared sensing adoption in phones and vehicles accelerates. The USD 9.5 billion 2025 base is common to both.
- 02Perovskite Quantum Dots share moves from 9% to 17%
Perovskite Quantum Dots grows at 20.42% against 12.5% for the market, adding revenue from USD 0.86 billion in 2025 to USD 4.73 billion in 2034 and taking its share from 9% to 17%. It is the place on this axis where share changes hands at scale, so it is where an entrant can take position without displacing the incumbent in Cadmium-Based Quantum Dots.
Market Challenges
One material type line carries the market
Market Challenges
2- 01One material type line carries the market
Cadmium-Based Quantum Dots is 38% of 2025 revenue at USD 3.61 billion and still 22% at USD 6.13 billion in 2034. No other single change on the material type axis moves the total as much as a change in demand for that one line.
- 02Asia Pacific is largely China
Of Asia Pacific's USD 4.47 billion in 2025, USD 2.05 billion (45.86%) comes from China alone, rising to USD 6.9 billion by 2034. A regional number that depends this heavily on one country carries that country's specific conditions inside it, which a reader treating the region as diversified would miss.
Segmentation Analysis
10 axesSegmentation runs along ten axes: material type, product form, display architecture, synthesis method, application, end-use industry, emission wavelength, display size, shell and surface chemistry and sales channel. Revenue does not add across them: each is a different cut of the same total.
There are six lines on the material type axis, and all of them grow in revenue between 2025 and 2034. What separates them is share: four gain it, the rest give it up.
By Material Type · 6 segments
Perovskite Quantum Dots Outpaces the Axis While Cadmium-Based Quantum Dots Holds the Largest Share
- Largest Cadmium-Based Quantum Dots · 38%
- Fastest Perovskite Quantum Dots · 20.4%
- Moves most Cadmium-Based Quantum Dots · -16 pts
- Order by 2034 changes
| Segment | 2025 | Share | 2034 | Share | CAGR |
|---|---|---|---|---|---|
| Cadmium-Based Quantum Dots | $3.61B | 38% | $6.13B | 22%-16 | 5.7% |
| Cadmium-Free Quantum Dots | $3.23B | 34% | $11.70B | 42%+8 | 15.1% |
| Perovskite Quantum Dots | $0.86B | 9% | $4.73B | 17%+8 | 20.4% |
| Carbon and Graphene Quantum Dots | $0.76B | 8% | $2.51B | 9%+1 | 14% |
| Silicon and Germanium Quantum Dots | $0.28B | 3% | $1.11B | 4%+1 | 15.9% |
| Lead Chalcogenide Quantum Dots | $0.76B | 8% | $1.67B | 6%-2 | 8.8% |
Cadmium-free dots lead because display makers in regulated markets moved to heavy-metal-free emitters while holding colour purity, and they now carry the volume of new panel launches. Perovskite dots grow fastest because they offer narrow emission and low-cost solution processing, and device makers are qualifying them for colour conversion layers and emissive displays as stability improves. Leadership changes hands: Cadmium-Free Quantum Dots is the largest line by 2034, not Cadmium-Based Quantum Dots. Every year of the series is priced on this axis, making it the reference cut for the rest of the report.
By Product Form · 6 segments
Quantum Dot Film (QDEF) Led by Product form in 2025, with Quantum Dot Ink Growing Fastest
- Largest Quantum Dot Film (QDEF) · 46%
- Fastest Quantum Dot Ink · 19.5%
- Moves most Quantum Dot Film (QDEF) · -8 pts
- Order by 2034 changes
| Segment | 2025 | Share | 2034 | Share | CAGR |
|---|---|---|---|---|---|
| Quantum Dot Film (QDEF) | $4.37B | 46% | $10.58B | 38%-8 | 10.3% |
| Quantum Dot Ink | $0.95B | 10% | $4.73B | 17%+7 | 19.5% |
| Quantum Dot Powder | $1.33B | 14% | $3.34B | 12%-2 | 10.8% |
| Quantum Dot Solution/Dispersion | $1.71B | 18% | $5.57B | 20%+2 | 14% |
| Quantum Dot Glass/Optical Plate | $0.67B | 7% | $2.23B | 8%+1 | 14.3% |
| Quantum Dot Rail/Tube | $0.47B | 5% | $1.39B | 5% | 12.8% |
Film leads because television and monitor makers buy quantum dots mostly as enhancement film that drops into existing backlight stacks. Ink grows fastest because printed and coated colour conversion layers and emissive devices need dots in a processable liquid form, and ink volumes follow those production lines as they scale. By 2034 Quantum Dot Film (QDEF) is still ahead, making this a shift in weight, not a change of leader.
By Display Architecture · 3 segments
Photoluminescent QD (QD-LCD) Held the Dominant Share of the Display architecture Segment in 2025
- Largest Photoluminescent QD (QD-LCD) · 58%
- Fastest Electroluminescent QD (QLED) · 22.8%
- Moves most Photoluminescent QD (QD-LCD) · -22 pts
- Order by 2034 changes
| Segment | 2025 | Share | 2034 | Share | CAGR |
|---|---|---|---|---|---|
| Photoluminescent QD (QD-LCD) | $5.51B | 58% | $10.03B | 36%-22 | 6.9% |
| QD Color Conversion Layer | $2.85B | 30% | $10.58B | 38%+8 | 15.7% |
| Electroluminescent QD (QLED) | $1.14B | 12% | $7.24B | 26%+14 | 22.8% |
Photoluminescent dots in LCD backlights lead today because they are the established route in televisions and monitors with a mature supply chain. Electroluminescent QLED grows fastest from a small base because self-emissive panels remove the backlight and colour filter, and each manufacturing and lifetime milestone opens volume for it. By 2034 the largest line is QD Color Conversion Layer and no longer Photoluminescent QD (QD-LCD), the one axis here where the order actually changes.
By Synthesis Method · 5 segments
Continuous Flow Synthesis Outpaces the Axis While Colloidal Hot-Injection Holds the Largest Share
- Largest Colloidal Hot-Injection · 52%
- Fastest Continuous Flow Synthesis · 20.7%
- Moves most Colloidal Hot-Injection · -12 pts
- Order by 2034 changes
| Segment | 2025 | Share | 2034 | Share | CAGR |
|---|---|---|---|---|---|
| Colloidal Hot-Injection | $4.94B | 52% | $11.14B | 40%-12 | 9.4% |
| Continuous Flow Synthesis | $1.33B | 14% | $7.24B | 26%+12 | 20.7% |
| Heat-Up Synthesis | $1.71B | 18% | $4.73B | 17%-1 | 12% |
| Top-Down Fabrication | $0.95B | 10% | $2.51B | 9%-1 | 11.4% |
| Epitaxial Growth | $0.57B | 6% | $2.23B | 8%+2 | 16.4% |
Colloidal hot-injection leads because it gives the tight size distribution that colour purity depends on, and most qualified supply uses it. Continuous flow synthesis grows fastest because panel volumes need consistent batches at lower cost per unit, and producers are moving qualified recipes from batch reactors into flow lines. The order does not change: Colloidal Hot-Injection is still largest in 2034, and what moves is how much it holds.
By Application · 7 segments
By Application
- Largest Displays · 66%
- Fastest Image Sensors and Photodetectors · 20.8%
- Moves most Displays · -16 pts
- Order by 2034 changes
| Segment | 2025 | Share | 2034 | Share | CAGR |
|---|---|---|---|---|---|
| Displays | $6.27B | 66% | $13.93B | 50%-16 | 9.3% |
| Lighting | $0.57B | 6% | $1.67B | 6% | 12.7% |
| Photovoltaics and Solar Cells | $0.57B | 6% | $2.51B | 9%+3 | 17.9% |
| Image Sensors and Photodetectors | $0.66B | 7% | $3.62B | 13%+6 | 20.8% |
| Biomedical Imaging and Diagnostics | $0.57B | 6% | $2.51B | 9%+3 | 17.9% |
| Lasers and Optoelectronics | $0.48B | 5% | $1.67B | 6%+1 | 14.9% |
| Quantum Computing and Photonics | $0.38B | 4% | $1.95B | 7%+3 | 19.9% |
2025 to 2034 revenue and share by line: Displays USD 6.27 billion to USD 13.93 billion (66% to 50%), Image Sensors and Photodetectors USD 0.66 billion to USD 3.62 billion (7% to 13%), Lighting USD 0.57 billion to USD 1.67 billion (6% to 6%), Photovoltaics and Solar Cells USD 0.57 billion to USD 2.51 billion (6% to 9%), Biomedical Imaging and Diagnostics USD 0.57 billion to USD 2.51 billion (6% to 9%), Lasers and Optoelectronics USD 0.48 billion to USD 1.67 billion (5% to 6%), Quantum Computing and Photonics USD 0.38 billion to USD 1.95 billion (4% to 7%). Displays Led by Application in 2025, with Image Sensors and Photodetectors Growing Fastest Displays lead because televisions, monitors and tablets are the only application where quantum dots are bought in large, repeat volumes. Image sensors and photodetectors grow fastest because infrared sensing in phones, vehicles and industrial inspection is a new use for the technology, and it adds demand beyond the display cycle. The order does not change: Displays is still largest in 2034, and what moves is how much it holds.
By End-use Industry · 7 segments
By End-use Industry
- Largest Consumer Electronics · 70%
- Fastest Automotive · 19.3%
- Moves most Consumer Electronics · -18 pts
- Order by 2034 unchanged
| Segment | 2025 | Share | 2034 | Share | CAGR |
|---|---|---|---|---|---|
| Consumer Electronics | $6.65B | 70% | $14.48B | 52%-18 | 9% |
| Healthcare and Life Sciences | $0.66B | 7% | $3.06B | 11%+4 | 18.6% |
| Automotive | $0.57B | 6% | $2.79B | 10%+4 | 19.3% |
| Energy | $0.57B | 6% | $2.79B | 10%+4 | 19.3% |
| Aerospace and Defense | $0.29B | 3% | $1.11B | 4%+1 | 16.1% |
| Agriculture | $0.19B | 2% | $0.84B | 3%+1 | 18% |
| Telecommunications | $0.57B | 6% | $2.79B | 10%+4 | 19.3% |
2025 to 2034 revenue and share by line: Consumer Electronics USD 6.65 billion to USD 14.48 billion (70% to 52%), Healthcare and Life Sciences USD 0.66 billion to USD 3.06 billion (7% to 11%), Automotive USD 0.57 billion to USD 2.79 billion (6% to 10%), Energy USD 0.57 billion to USD 2.79 billion (6% to 10%), Telecommunications USD 0.57 billion to USD 2.79 billion (6% to 10%), Aerospace and Defense USD 0.29 billion to USD 1.11 billion (3% to 4%), Agriculture USD 0.19 billion to USD 0.84 billion (2% to 3%). Consumer Electronics Led by End-use industry in 2025, with Automotive Growing Fastest Consumer electronics leads because televisions, monitors, phones and tablets absorb most quantum dot output. Automotive, energy and telecommunications grow fastest from small bases as vehicle displays, infrared sensing, solar layers and optical components qualify quantum dots, and these buyers sign multi-year supply agreements once a part is approved. By 2034 Consumer Electronics is still ahead, making this a shift in weight, not a change of leader.
By Emission Wavelength · 5 segments
Red Emitting Led by Emission wavelength in 2025, with Blue Emitting Growing Fastest
- Largest Red Emitting · 30%
- Fastest Blue Emitting · 17.3%
- Moves most Blue Emitting · +6 pts
- Order by 2034 unchanged
| Segment | 2025 | Share | 2034 | Share | CAGR |
|---|---|---|---|---|---|
| Red Emitting | $2.85B | 30% | $7.24B | 26%-4 | 10.9% |
| Green Emitting | $2.85B | 30% | $7.24B | 26%-4 | 10.9% |
| Blue Emitting | $1.33B | 14% | $5.57B | 20%+6 | 17.3% |
| Near-Infrared and Short-Wave Infrared Emitting | $1.90B | 20% | $6.13B | 22%+2 | 13.9% |
| Ultraviolet Emitting | $0.57B | 6% | $1.67B | 6% | 12.7% |
Red and green emitters lead together because every quantum dot display needs both to convert a blue backlight into white light. Blue emitters grow fastest because self-emissive and colour conversion designs need a blue dot of workable lifetime, and progress in cadmium-free blue is releasing demand held back until now. By 2034 Red Emitting is still ahead, making this a shift in weight, not a change of leader.
By Display Size · 5 segments
Scale in 33 to 55 Inches and Growth in Above 75 Inches Define the Display size Axis
- Largest 33 to 55 Inches · 36%
- Fastest Above 75 Inches · 21.7%
- Moves most 33 to 55 Inches · -6 pts
- Order by 2034 changes
| Segment | 2025 | Share | 2034 | Share | CAGR |
|---|---|---|---|---|---|
| Below 10 Inches | $1.52B | 16% | $3.90B | 14%-2 | 11% |
| 10 to 32 Inches | $1.71B | 18% | $3.90B | 14%-4 | 9.6% |
| 33 to 55 Inches | $3.42B | 36% | $8.36B | 30%-6 | 10.4% |
| 56 to 75 Inches | $2.28B | 24% | $8.36B | 30%+6 | 15.5% |
| Above 75 Inches | $0.57B | 6% | $3.34B | 12%+6 | 21.7% |
Mid-sized panels lead because the television mainstream sits in the middle of the size range, where quantum dot film is a standard option. Panels above 75 inches grow fastest because large-format televisions and commercial displays are where wide colour gamut and high brightness justify the added material cost per unit of area. The order does not change: 33 to 55 Inches is still largest in 2034, and what moves is how much it holds.
By Shell and Surface Chemistry · 4 segments
Core-Shell Held the Dominant Share of the Shell and surface chemistry Segment in 2025
- Largest Core-Shell · 50%
- Fastest Ligand-Engineered/Encapsulated · 19.6%
- Moves most Core-Shell · -12 pts
- Order by 2034 unchanged
| Segment | 2025 | Share | 2034 | Share | CAGR |
|---|---|---|---|---|---|
| Core-Only | $1.14B | 12% | $1.67B | 6%-6 | 4.3% |
| Core-Shell | $4.75B | 50% | $10.58B | 38%-12 | 9.3% |
| Core-Multishell | $2.28B | 24% | $8.91B | 32%+8 | 16.4% |
| Ligand-Engineered/Encapsulated | $1.33B | 14% | $6.68B | 24%+10 | 19.6% |
Core-shell structures lead because a single shell gives the efficiency and stability that panel makers need at a workable cost. Ligand-engineered and encapsulated dots grow fastest because ink processing, perovskite materials and printed devices need surface treatment that protects the emitter from moisture, heat and light. The order does not change: Core-Shell is still largest in 2034, and what moves is how much it holds.
By Sales Channel · 4 segments
Online Catalog Sales Outpaces the Axis While Direct Sales to Panel/Device Makers Holds the Largest Share
- Largest Direct Sales to Panel/Device Makers · 44%
- Fastest Online Catalog Sales · 17.9%
- Moves most Through Optical Film Converters · -8 pts
- Order by 2034 unchanged
| Segment | 2025 | Share | 2034 | Share | CAGR |
|---|---|---|---|---|---|
| Direct Sales to Panel/Device Makers | $4.18B | 44% | $13.37B | 48%+4 | 13.8% |
| Through Optical Film Converters | $3.61B | 38% | $8.36B | 30%-8 | 9.8% |
| Distributors | $1.14B | 12% | $3.62B | 13%+1 | 13.7% |
| Online Catalog Sales | $0.57B | 6% | $2.51B | 9%+3 | 17.9% |
Direct sales to panel and device makers lead because qualified dot suppliers work with a few large buyers under long supply agreements. Direct sales also grow fastest in the forecast as ink and colour conversion programmes need joint development and tight process support that a reseller cannot provide. Direct Sales to Panel/Device Makers remains the largest line through 2034, so the axis changes in proportion, not in order.
Regional Insights
Regional Revenue Share
Base year 2025Share of global revenue in the base year.
Only the leading region's share is published outside the report; pins mark the region, not a specific country.
North America Market Analysis
The 2nd-largest region covered — 2 points of share move elsewhere by 2034, while revenue still grows 2.7×.
- Rank 2 of 5
- 2025 share 24%
- By 2034 22%
- Revenue $2.28B → $6.13B
North America holds 24% of the global quantum dots market in 2025, worth USD 2.28 billion on the way to USD 6.13 billion by 2034. That makes it the second-largest region covered, in 2025 and again in 2034.
Share settles at 22% in 2034, though revenue still rises throughout; the shift is in the region's weight against faster-growing ones, which is not the same as weakening demand.
The material type mix reported at global level applies here, with Cadmium-Based Quantum Dots the largest line at 38% of 2025 revenue and Perovskite Quantum Dots the fastest-growing at 20.42%. Revenue for North America is broken out by every segmentation axis and by country in the full report.
United States
Sets the pace for North America at 85.5% of it, growing 2.7×.
- In region 1 of 2
- Of region 85.5%
- Of global 20.5%
- Revenue $1.95B → $5.20B
The largest single market in North America is the United States, at USD 1.95 billion in 2025 and USD 5.2 billion in 2034. At 85.53% of regional revenue in the base year it is not one market among several, the region's trajectory is largely this country's trajectory. Against regional totals of USD 2.28 billion in 2025 and USD 6.13 billion in 2034, it is the country the full report breaks out in detail.
The material type pattern in the United States is the global one: 38% of 2025 revenue in Cadmium-Based Quantum Dots, 22% by 2034, against 20.42% growth in Perovskite Quantum Dots taking it from 9% to 17%. Because the country carries 85.53% of North America, a movement in its own mix shows up in the regional totals instead of being averaged away by neighbouring markets. Revenue by material type for the United States is reported separately in the full report.
Quantum dots sold in the United States fall mainly under the Toxic Substances Control Act, administered by the Environmental Protection Agency. Cadmium-free and cadmium-based nanocrystals alike are treated as chemical substances, so a supplier must confirm the material is on the TSCA inventory or file a premanufacture notice before commercial manufacture or import. Nanoscale forms of an existing substance can draw their own reporting requirements. Workplace handling is overseen by the Occupational Safety and Health Administration through hazard communication, which obliges safety data sheets and container labels. Where dots enter displays or electronics, the product is governed by general consumer-product safety rules, and use in medical imaging would add review by the Food and Drug Administration.
Shoei Chemical Inc. (Nanosys), Samsung Electronics Co., Ltd., Merck KGaA, Nanoco Group plc, Ocean NanoTech, LLC, Quantum Materials Corp., Najing Technology Corporation Ltd., Quantum Solutions L.L.C., Avantama AG, NN-Labs, LLC, UbiQD, Inc., Crystalplex Corporation, Thermo Fisher Scientific Inc., Sigma-Aldrich (MilliporeSigma), Hansol Chemical Co., Ltd., Dongjin Semichem Co., Ltd., Shenzhen Planck Quantum Dot Technology Co., Ltd., Zhejiang Zhijiang Quantum Dot Co., Ltd., Suzhou Xingshuo Nanotech Co., Ltd. (Mesolight), Quantum Science Ltd., LG Display Co., Ltd., TCL Technology Group Corporation, Hisense Visual Technology Co., Ltd., Corning Incorporated, 3M Company, QD Laser, Inc., Qustomdot B.V. and Persistence Market Research Quantum Dots Pty (Quantum Materials Australia) are the suppliers covered in the United States. Cadmium-Based Quantum Dots, at 38% of 2025 revenue, is where the volume sits, and Perovskite Quantum Dots, growing at 20.42%, is where position changes hands over the forecast period. Country-level shares and positioning per company sit in the full report.
Canada
2nd-largest in North America, growing 2.8×.
- In region 2 of 2
- Of region 5.3%
- Of global 1.3%
- Revenue $0.12B → $0.33B
Within North America, Canada accounts for 5.26% of regional revenue and 1.26% of the global total, worth USD 0.12 billion in 2025 and USD 0.33 billion by 2034.
Europe Market Analysis
The 3rd-largest region covered — 2 points of share move elsewhere by 2034, while revenue still grows 2.6×.
- Rank 3 of 5
- 2025 share 20%
- By 2034 18%
- Revenue $1.90B → $5.01B
20% of the global quantum dots market sits in Europe in 2025, worth USD 1.9 billion with USD 5.01 billion projected for 2034. That makes it the third-largest region covered, in 2025 and again in 2034.
18% of global revenue sits here in 2034, below the 2025 level, though revenue still rises throughout; the shift is in the region's weight against faster-growing ones, which is not the same as weakening demand.
The material type mix reported at global level applies here, with Cadmium-Based Quantum Dots the largest line at 38% of 2025 revenue and Perovskite Quantum Dots the fastest-growing at 20.42%. The full report breaks Europe out along every axis and by country.
Germany
The largest market in Europe, growing 2.6×.
- In region 1 of 3
- Of region 31.6%
- Of global 6.3%
- Revenue $0.60B → $1.55B
Germany is the largest market within Europe, generating USD 0.6 billion in 2025 and projected to reach USD 1.55 billion by 2034. Its 31.58% of base-year regional revenue leads the region, though enough sits elsewhere that Europe is not a proxy for it. Set against USD 1.9 billion and USD 5.01 billion for the region, it is why this market, and not a smaller one, is the one reported in full.
Composition here matches the global split: the largest line is Cadmium-Based Quantum Dots at 38% of 2025 revenue, easing to 22% by 2034, and the fastest is Perovskite Quantum Dots at 20.42%, from 9% to 17%. Its 31.58% weight in Europe means those movements carry straight into the regional totals. Per-material type revenue for Germany appears on its own in the full report.
Germany applies the European Union chemicals framework directly. Under the REACH Regulation, a supplier manufacturing or importing quantum dots must register the substance with the European Chemicals Agency, and nanoforms need to be characterised within that dossier. The CLP Regulation sets classification, labelling and packaging duties, so hazard pictograms and safety data sheets accompany each shipment. Cadmium-bearing dots meet a further barrier in the RoHS Directive, which restricts cadmium in electrical and electronic equipment and has pushed display makers toward cadmium-free formulations. National enforcement sits with state authorities, coordinated federally by the Federal Institute for Occupational Safety and Health and the Federal Environment Agency.
Shoei Chemical Inc. (Nanosys), Samsung Electronics Co., Ltd., Merck KGaA, Nanoco Group plc, Ocean NanoTech, LLC, Quantum Materials Corp., Najing Technology Corporation Ltd., Quantum Solutions L.L.C., Avantama AG, NN-Labs, LLC, UbiQD, Inc., Crystalplex Corporation, Thermo Fisher Scientific Inc., Sigma-Aldrich (MilliporeSigma), Hansol Chemical Co., Ltd., Dongjin Semichem Co., Ltd., Shenzhen Planck Quantum Dot Technology Co., Ltd., Zhejiang Zhijiang Quantum Dot Co., Ltd., Suzhou Xingshuo Nanotech Co., Ltd. (Mesolight), Quantum Science Ltd., LG Display Co., Ltd., TCL Technology Group Corporation, Hisense Visual Technology Co., Ltd., Corning Incorporated, 3M Company, QD Laser, Inc., Qustomdot B.V. and Persistence Market Research Quantum Dots Pty (Quantum Materials Australia) are the suppliers covered in Germany. The commercially relevant division is 38% of 2025 revenue in Cadmium-Based Quantum Dots, where the volume is, against 20.42% growth in Perovskite Quantum Dots, where share moves. The commercial size of that position is USD 1.9 billion in 2025 and USD 5.01 billion by 2034, 20% of the global total in the base year.
United Kingdom
2nd-largest in Europe, growing 2.8×.
- In region 2 of 3
- Of region 20%
- Of global 4%
- Revenue $0.38B → $1.05B
4% of global revenue is generated in the United Kingdom; USD 0.38 billion in 2025, reaching USD 1.05 billion in 2034, and 20% of Europe.
France
3rd-largest in Europe, growing 2.8×.
- In region 3 of 3
- Of region 13.2%
- Of global 2.6%
- Revenue $0.25B → $0.70B
France is sized at USD 0.25 billion in 2025, rising to USD 0.7 billion by 2034; 2.63% of global revenue and 13.16% of Europe. It is reported separately from Germany across every segmentation axis in the full report.
Asia Pacific Market Analysis
The largest region covered, and the one gaining the most — it picks up 3 points of share by 2034, while revenue still grows 3.1×.
- Rank 1 of 5
- 2025 share 47%
- By 2034 50%
- Revenue $4.47B → $13.93B
In Asia Pacific, 47% of global revenue puts 2025 at USD 4.47 billion on the way to USD 13.93 billion by 2034. That makes it the first-largest region covered, in 2025 and again in 2034.
50% of global revenue sits here by 2034, up from the 2025 level, because it outgrows the market's 12.5%; the revenue added here is disproportionate to where the region started.
The material type mix reported at global level applies here, with Cadmium-Based Quantum Dots the largest line at 38% of 2025 revenue and Perovskite Quantum Dots the fastest-growing at 20.42%. Revenue for Asia Pacific is broken out by every segmentation axis and by country in the full report.
China
The largest market in Asia Pacific, growing 3.4×.
- In region 1 of 3
- Of region 45.9%
- Of global 21.6%
- Revenue $2.05B → $6.90B
China is the largest market within Asia Pacific, generating USD 2.05 billion in 2025 and projected to reach USD 6.9 billion by 2034. Its 45.86% of base-year regional revenue leads the region, though enough sits elsewhere that Asia Pacific is not a proxy for it. Against regional totals of USD 4.47 billion in 2025 and USD 13.93 billion in 2034, it is the country the full report breaks out in detail.
Composition here matches the global split: the largest line is Cadmium-Based Quantum Dots at 38% of 2025 revenue, easing to 22% by 2034, and the fastest is Perovskite Quantum Dots at 20.42%, from 9% to 17%. Because the country carries 45.86% of Asia Pacific, a movement in its own mix shows up in the regional totals instead of being averaged away by neighbouring markets. China carries its own material type breakdown in the full report.
In China, quantum dots are regulated as chemical substances under the Ministry of Ecology and Environment, whose Measures for the Environmental Administration of New Chemical Substances require registration of a new substance before production or import. The applicant submits hazard and exposure data, and a notification category determines the testing burden. Hazardous chemicals are also subject to safety licensing, storage and transport controls overseen by emergency management authorities, with labels and safety data sheets prepared in Chinese. Electronic products containing the material must observe China's restriction rules on hazardous substances, and conformity to national GB standards is commonly expected by display and lighting buyers.
In China the field is Shoei Chemical Inc. (Nanosys), Samsung Electronics Co., Ltd., Merck KGaA, Nanoco Group plc, Ocean NanoTech, LLC, Quantum Materials Corp., Najing Technology Corporation Ltd., Quantum Solutions L.L.C., Avantama AG, NN-Labs, LLC, UbiQD, Inc., Crystalplex Corporation, Thermo Fisher Scientific Inc., Sigma-Aldrich (MilliporeSigma), Hansol Chemical Co., Ltd., Dongjin Semichem Co., Ltd., Shenzhen Planck Quantum Dot Technology Co., Ltd., Zhejiang Zhijiang Quantum Dot Co., Ltd., Suzhou Xingshuo Nanotech Co., Ltd. (Mesolight), Quantum Science Ltd., LG Display Co., Ltd., TCL Technology Group Corporation, Hisense Visual Technology Co., Ltd., Corning Incorporated, 3M Company, QD Laser, Inc., Qustomdot B.V. and Persistence Market Research Quantum Dots Pty (Quantum Materials Australia). Two different problems sit on the same axis: holding Cadmium-Based Quantum Dots at 38% of 2025 revenue, and taking Perovskite Quantum Dots while it grows at 20.42%. The commercial size of that position is USD 4.47 billion in 2025, moving to USD 13.93 billion by 2034 across the forecast period.
South Korea
2nd-largest in Asia Pacific, growing 2.7×.
- In region 2 of 3
- Of region 25.7%
- Of global 12.1%
- Revenue $1.15B → $3.10B
South Korea is sized at USD 1.15 billion in 2025, rising to USD 3.1 billion by 2034; 12.11% of global revenue and 25.73% of Asia Pacific. It is reported separately from China across every segmentation axis in the full report.
Japan
3rd-largest in Asia Pacific, growing 2.6×.
- In region 3 of 3
- Of region 13.9%
- Of global 6.5%
- Revenue $0.62B → $1.60B
Japan is sized at USD 0.62 billion in 2025, rising to USD 1.6 billion by 2034; 6.53% of global revenue and 13.87% of Asia Pacific. It is reported separately from China across every segmentation axis in the full report.
Latin America Market Analysis
The 5th-largest region covered — it picks up 0.5 points of share by 2034, while revenue still grows 3.3×.
- Rank 5 of 5
- 2025 share 4%
- By 2034 4.5%
- Revenue $0.38B → $1.25B
4% of the global quantum dots market sits in Latin America in 2025, worth USD 0.38 billion on the way to USD 1.25 billion by 2034. It is a marginal region on this axis, fifth by revenue throughout the period.
Its share rises to 4.5% over the forecast period, so the region grows faster than the market's 12.5% and takes a larger part of the revenue added by 2034 than its 2025 weight implies.
The material type mix reported at global level applies here, with Cadmium-Based Quantum Dots the largest line at 38% of 2025 revenue and Perovskite Quantum Dots the fastest-growing at 20.42%. Latin America is reported axis by axis and country by country in the full study.
Brazil
The largest market in Latin America, growing 3.4×.
- In region 1 of 2
- Of region 50%
- Of global 2%
- Revenue $0.19B → $0.65B
USD 0.19 billion of Latin America's 2025 revenue is generated in Brazil, the region's largest market, reaching USD 0.65 billion by 2034. At 50% of the region in 2025 it leads, but a majority of Latin America's revenue is generated in other markets. Against regional totals of USD 0.38 billion in 2025 and USD 1.25 billion in 2034, it is the country the full report breaks out in detail.
Brazil buys along the same lines as the market globally; Cadmium-Based Quantum Dots first at 38% of 2025 revenue and 22% in 2034, Perovskite Quantum Dots fastest at 20.42% on a share moving from 9% to 17%. Since 50% of Latin America's revenue is generated here, the regional numbers inherit this market's mix instead of smoothing it out. Per-material type revenue for Brazil appears on its own in the full report.
Brazil has historically handled industrial chemicals through a patchwork of agencies, with environmental oversight from IBAMA, workplace and transport rules from labour and transport authorities, and customs controls at import. A newer national framework for industrial chemicals, administered through the environment ministry, is moving the country toward an inventory and notification model similar to those used elsewhere. Suppliers should expect to provide safety data sheets and labels aligned with the Globally Harmonized System, as adopted in Brazilian technical standards by ABNT. Electronic goods that contain the material may also meet restrictions on hazardous substances, and product certification for finished devices is handled by INMETRO or ANATEL depending on the category.
Shoei Chemical Inc. (Nanosys), Samsung Electronics Co., Ltd., Merck KGaA, Nanoco Group plc, Ocean NanoTech, LLC, Quantum Materials Corp., Najing Technology Corporation Ltd., Quantum Solutions L.L.C., Avantama AG, NN-Labs, LLC, UbiQD, Inc., Crystalplex Corporation, Thermo Fisher Scientific Inc., Sigma-Aldrich (MilliporeSigma), Hansol Chemical Co., Ltd., Dongjin Semichem Co., Ltd., Shenzhen Planck Quantum Dot Technology Co., Ltd., Zhejiang Zhijiang Quantum Dot Co., Ltd., Suzhou Xingshuo Nanotech Co., Ltd. (Mesolight), Quantum Science Ltd., LG Display Co., Ltd., TCL Technology Group Corporation, Hisense Visual Technology Co., Ltd., Corning Incorporated, 3M Company, QD Laser, Inc., Qustomdot B.V. and Persistence Market Research Quantum Dots Pty (Quantum Materials Australia) are the suppliers covered in Brazil. Two different problems sit on the same axis: holding Cadmium-Based Quantum Dots at 38% of 2025 revenue, and taking Perovskite Quantum Dots while it grows at 20.42%. The commercial size of that position is USD 0.38 billion in 2025, moving to USD 1.25 billion by 2034 across the forecast period.
Mexico
2nd-largest in Latin America, growing 3.6×.
- In region 2 of 2
- Of region 23.7%
- Of global 0.9%
- Revenue $0.09B → $0.32B
Mexico is sized at USD 0.09 billion in 2025, rising to USD 0.32 billion by 2034; 0.95% of global revenue and 23.68% of Latin America. It is reported separately from Brazil across every segmentation axis in the full report.
Middle East and Africa Market Analysis
The 4th-largest region covered — it picks up 0.5 points of share by 2034, while revenue still grows 3.3×.
- Rank 4 of 5
- 2025 share 5%
- By 2034 5.5%
- Revenue $0.47B → $1.53B
Middle East and Africa holds 5% of the global quantum dots market in 2025, worth USD 0.47 billion on the way to USD 1.53 billion by 2034. That makes it the fourth-largest region covered, in 2025 and again in 2034.
Share climbs to 5.5% by 2034, at a pace above the 12.5% global rate, so this region warrants separate treatment and should not be scaled off the total.
Cadmium-Based Quantum Dots leads here as it does globally, at 38% of 2025 revenue, and Perovskite Quantum Dots again grows fastest at 20.42%. Middle East and Africa is reported axis by axis and country by country in the full study.
Israel
The largest market in Middle East and Africa, growing 3.2×.
- In region 1 of 2
- Of region 25.5%
- Of global 1.3%
- Revenue $0.12B → $0.38B
25.53% of Middle East and Africa's base-year revenue comes from Israel; USD 0.12 billion, rising to USD 0.38 billion by 2034. 25.53% of the region in the base year makes it the largest market here without making it the region. The region itself runs USD 0.47 billion to USD 1.53 billion over the same period, and this is the market carrying the country-level detail in the full report.
Composition here matches the global split: the largest line is Cadmium-Based Quantum Dots at 38% of 2025 revenue, easing to 22% by 2034, and the fastest is Perovskite Quantum Dots at 20.42%, from 9% to 17%. Its 25.53% weight in Middle East and Africa means those movements carry straight into the regional totals. The full report reports Israel by material type separately.
In Israel, the Ministry of Environmental Protection is the main authority for chemical substances, operating under the Hazardous Substances Law. Businesses that handle hazardous materials need a poison permit or a related licence, and imports can require notification before clearance at the border. Labels and safety data sheets follow the Globally Harmonized System as applied through Israeli standards. Because many Israeli quantum dot activities are research-led, university and laboratory use is also governed by occupational safety rules from the Ministry of Labor. Finished electronic products must satisfy the Standards Institution of Israel, and many suppliers align with European restrictions on hazardous substances to ease export.
Shoei Chemical Inc. (Nanosys), Samsung Electronics Co., Ltd., Merck KGaA, Nanoco Group plc, Ocean NanoTech, LLC, Quantum Materials Corp., Najing Technology Corporation Ltd., Quantum Solutions L.L.C., Avantama AG, NN-Labs, LLC, UbiQD, Inc., Crystalplex Corporation, Thermo Fisher Scientific Inc., Sigma-Aldrich (MilliporeSigma), Hansol Chemical Co., Ltd., Dongjin Semichem Co., Ltd., Shenzhen Planck Quantum Dot Technology Co., Ltd., Zhejiang Zhijiang Quantum Dot Co., Ltd., Suzhou Xingshuo Nanotech Co., Ltd. (Mesolight), Quantum Science Ltd., LG Display Co., Ltd., TCL Technology Group Corporation, Hisense Visual Technology Co., Ltd., Corning Incorporated, 3M Company, QD Laser, Inc., Qustomdot B.V. and Persistence Market Research Quantum Dots Pty (Quantum Materials Australia) are the suppliers covered in Israel. Volume sits in Cadmium-Based Quantum Dots at 38% of 2025 revenue; movement sits in Perovskite Quantum Dots at 20.42% growth. The commercial size of that position is USD 0.47 billion in 2025, moving to USD 1.53 billion by 2034 across the forecast period.
South Africa
2nd-largest in Middle East and Africa, growing 2.8×.
- In region 2 of 2
- Of region 10.6%
- Of global 0.5%
- Revenue $0.05B → $0.14B
0.53% of global revenue is generated in South Africa; USD 0.05 billion in 2025, reaching USD 0.14 billion in 2034, and 10.64% of Middle East and Africa.
Download a free sample to see the full data tables and segment-level detail behind this analysis.
Report Coverage
This report assesses the market across every segment, with revenue and a growth rate for each line in each year of the study period. It covers the drivers, trends, opportunities, restraints and challenges shaping growth, the competitive landscape and the companies profiled, and the research methodology behind every estimate. Segmentation is reported by material type, product form, display architecture, synthesis method, application, end-use industry, emission wavelength, display size, shell and surface chemistry, sales channel, and regional analysis covers North America, Europe, Asia Pacific, Latin America, Middle East and Africa, each broken out by country.
Competitive Landscape
Position on the Material type Axis Decides Competitive Standing
The suppliers covered are: Shoei Chemical Inc. (Nanosys), Samsung Electronics Co., Ltd., Merck KGaA, Nanoco Group plc, Ocean NanoTech, LLC, Quantum Materials Corp., Najing Technology Corporation Ltd., Quantum Solutions L.L.C., Avantama AG, NN-Labs, LLC, UbiQD, Inc., Crystalplex Corporation, Thermo Fisher Scientific Inc., Sigma-Aldrich (MilliporeSigma), Hansol Chemical Co., Ltd., Dongjin Semichem Co., Ltd., Shenzhen Planck Quantum Dot Technology Co., Ltd., Zhejiang Zhijiang Quantum Dot Co., Ltd., Suzhou Xingshuo Nanotech Co., Ltd. (Mesolight), Quantum Science Ltd., LG Display Co., Ltd., TCL Technology Group Corporation, Hisense Visual Technology Co., Ltd., Corning Incorporated, 3M Company, QD Laser, Inc., Qustomdot B.V. and Persistence Market Research Quantum Dots Pty (Quantum Materials Australia).
Where suppliers actually compete is along the material type axis. Cadmium-Based Quantum Dots is 38% of 2025 revenue at USD 3.61 billion and still 22% in 2034, so it is where the volume sits and where an incumbent's position is hardest to move. The line that changes hands is Perovskite Quantum Dots at 20.42%, well ahead of Cadmium-Based Quantum Dots at 5.71%. The two rarely sit with the same supplier, and that is the reason a USD 9.5 billion market is not already consolidated.
Suppliers separate on synthesis scale, batch-to-batch consistency, and the ability to supply cadmium-free dots that match the colour purity and efficiency of cadmium-based material. Qualification with display makers takes long and ties a supplier to a panel platform, so incumbents with approved recipes hold an advantage. The largest players add in-house film or panel manufacturing, patent portfolios, and secure precursor supply. Smaller and regional suppliers compete on speciality compositions such as perovskite and infrared dots, on research-grade catalogue products, on lower prices for local panel makers, and on fast custom development for sensor, biomedical and photonics customers.
The regional picture sets the entry cost: 47% of revenue is in Asia Pacific and 24% in North America, so a credible global position requires both, while Latin America at 4% can be served opportunistically.
Company-level profiles, financials, shares and development histories are held in the full report and not in this summary.
List of Key Quantum Dots Market Companies Profiled
28 companies profiled. Company profiles, including financials, product portfolios and recent developments, are part of the full report.
- Shoei Chemical Inc. (Nanosys)(Japan)
- Samsung Electronics Co., Ltd.(South Korea)
- Merck KGaA(Germany)
- Nanoco Group plc(United Kingdom)
- Ocean NanoTech, LLC(United States)
- Quantum Materials Corp.(United States)
- Najing Technology Corporation Ltd.(China)
- Quantum Solutions L.L.C.
- Avantama AG(Switzerland)
- NN-Labs, LLC(United States)
- UbiQD, Inc.(United States)
- Crystalplex Corporation(United States)
- Thermo Fisher Scientific Inc.(United States)
- Sigma-Aldrich (MilliporeSigma)(United States)
- Hansol Chemical Co., Ltd.(South Korea)
- Dongjin Semichem Co., Ltd.(South Korea)
- Shenzhen Planck Quantum Dot Technology Co., Ltd.(China)
- Zhejiang Zhijiang Quantum Dot Co., Ltd.(China)
- Suzhou Xingshuo Nanotech Co., Ltd. (Mesolight)(China)
- Quantum Science Ltd.
- LG Display Co., Ltd.(South Korea)
- TCL Technology Group Corporation(China)
- Hisense Visual Technology Co., Ltd.(China)
- Corning Incorporated(United States)
- 3M Company(United States)
- QD Laser, Inc.(Japan)
- Qustomdot B.V.(Netherlands)
- Persistence Market Research Quantum Dots Pty (Quantum Materials Australia)
Geographic Coverage
Every market below is broken out separately in the report.
North America
3Europe
8Asia Pacific
12Latin America
3Middle East and Africa
4Key Insights
Report Scope
Study parameters & segmentationThis study covers market size and forecasts over the 2020–2034 period, segmentation across 10 axes (Material Type, Product Form, Display Architecture, Synthesis Method, Application, End-use Industry, Emission Wavelength, Display Size, Shell and Surface Chemistry, Sales Channel), regional analysis for 5 regions and their constituent countries, a competitive landscape profiling 28 key companies, and the research methodology behind every estimate.
Segmentation
10 axes + regionQuestions This Report Answers
6 questionsWhat is the market size and growth rate, globally and by region?
How is the market segmented, and which segments lead?
Which regions and countries are covered, and how do they compare?
What are the key drivers, restraints, opportunities and challenges?
Who are the leading companies operating in this market?
What trends are expected to shape the market through the forecast period?
Frequently Asked Questions
01What is the Quantum Dots Market projected to reach?
USD 27.85 USD Billion by 2034, CAGR 12.5%
02What years does this report cover?
Study period 2020–2034, base year 2025, historical data 2020-2024, forecast period 2026-2034.
03Which regions are covered?
North America, Europe, Asia Pacific, Latin America, Middle East and Africa.
04Which region accounted for the largest market share?
Asia Pacific leads with 47% of global revenue through 2034.
05Which segment leads the market?
Cadmium-Based Quantum Dots is the largest line by material type, at 38% of revenue in 2025.
06Who are the key companies profiled?
Shoei Chemical Inc. (Nanosys), Samsung Electronics Co., Ltd., Merck KGaA, Nanoco Group plc, Ocean NanoTech, LLC, Quantum Materials Corp., Najing Technology Corporation Ltd., Quantum Solutions L.L.C., Avantama AG, NN-Labs, LLC, UbiQD, Inc., Crystalplex Corporation, Thermo Fisher Scientific Inc., Sigma-Aldrich (MilliporeSigma), Hansol Chemical Co., Ltd., Dongjin Semichem Co., Ltd., Shenzhen Planck Quantum Dot Technology Co., Ltd., Zhejiang Zhijiang Quantum Dot Co., Ltd., Suzhou Xingshuo Nanotech Co., Ltd. (Mesolight), Quantum Science Ltd., LG Display Co., Ltd., TCL Technology Group Corporation, Hisense Visual Technology Co., Ltd., Corning Incorporated, 3M Company, QD Laser, Inc., Qustomdot B.V., Persistence Market Research Quantum Dots Pty (Quantum Materials Australia). Full profiles are part of the paid report.
07Can the segmentation be customized?
Yes. Custom data cuts by geography, segment, or competitor set are available on request.
Why choose CDI
Need this report shaped around your question?
The scope isn't fixed. Tell us what your team needs that the standard edition doesn't cover, and an analyst will come back on what can be adjusted and how long it takes, before you commit to anything.
Most licences include 30–60 hours of customization at no extra cost. See what each licence includes
Additional Companies
Add competitors, suppliers or the peer set you benchmark against to the companies already covered.
Deeper Competitive View
Sharpen the landscape work around your own position: product line, channel, or a named shortlist of rivals.
Extra Segment Splits
Break the market down along an axis the standard scope doesn't cut it by, or go a level deeper inside one.
Application Focus
Narrow the analysis to the specific use cases and end users your team actually sells into.
Different Time Frame
Move the base year, or widen the historical and forecast windows the study is built on.
Country-Level Detail
Go below region level into the individual countries that matter to you, rather than the standard geography split.