
Neuromorphic Computing MarketSize, Share & Industry Analysis, 2026-2034By OfferingBy Hardware ArchitectureBy Neuron ModelBy DeploymentBy ApplicationBy Sensing ModalityBy Power ClassBy Business ModelBy Technology Maturity StageBy End User
Full title & scope — all 10 axes with their segments
Neuromorphic Computing Market Size, Share & Industry Analysis, By Offering (Hardware, Software, Services), By Hardware Architecture (Digital Spiking, Analog and Mixed-Signal, Memristor and In-Memory Computing, Photonic Neuromorphic, Hybrid and Other Architectures), By Neuron Model (Leaky Integrate-and-Fire, Izhikevich, Hodgkin-Huxley, Adaptive Exponential and Other Models), By Deployment (Edge, Cloud and Data Center, Research Clusters and Supercomputing), By Application (Image and Video Processing, Signal Processing, Data Processing and Optimization, Robotics and Motion Control, Anomaly and Predictive Maintenance, Sensory and Olfactory Processing), By Sensing Modality (Vision, Audio, Tactile and Haptic, Radar and Lidar, Biosignal, Chemical and Olfactory), By Power Class (Ultra-Low Power, Low Power, Mid Power, High Power), By Business Model (Packaged Chips and Modules, IP Licensing, Cloud and Access Services, Custom and Co-Development Programs), By Technology Maturity Stage (Research and Prototype Systems, Pilot and Evaluation Deployments, Commercial Production Devices), By End User (Automotive and Transportation, Consumer Electronics, Aerospace and Defense, Healthcare and Medical Devices, Industrial and Manufacturing, IT and Telecommunications, BFSI, Energy and Utilities, Academic and Research Institutions), and Regional Forecast, 2026-2034
Market outlook, key takeaways, drivers and challenges for the report period.
- 01By OfferingHardware · Software · Services
- 02By Hardware ArchitectureDigital Spiking · Analog and Mixed-Signal · Memristor and In-Memory Computing
- 03By Neuron ModelLeaky Integrate-and-Fire · Izhikevich · Hodgkin-Huxley
- 04By DeploymentEdge · Cloud and Data Center · Research Clusters and Supercomputing
- 05By ApplicationImage and Video Processing · Signal Processing · Data Processing and Optimization
- 06By Sensing ModalityVision · Audio · Tactile and Haptic
- 07By Power ClassUltra-Low Power · Low Power · Mid Power
- 08By Business ModelPackaged Chips and Modules · IP Licensing · Cloud and Access Services
- 09By Technology Maturity StageResearch and Prototype Systems · Pilot and Evaluation Deployments · Commercial Production Devices
- 10By End UserAutomotive and Transportation · Consumer Electronics · Aerospace and Defense
- 11By Region
Market Analysis & Outlook
Neuromorphic computing covers processors, sensors, software and services that process information with spiking, event-driven circuits modelled on biological neurons, so that power is spent only when a signal changes. It takes the form of digital, analog, memristor-based and photonic chips, development boards, intellectual property cores, programming toolchains and hosted access. Buyers include automotive and industrial system makers, consumer device brands, defence agencies, medical device makers, data center operators and research laboratories.
The global neuromorphic computing market stood at USD 6.4 billion in 2025. A forecast-period rate of 21% takes it to USD 36.3 billion by 2034, and the study reports every year in between, passing USD 1.6 billion in 2020, USD 4.85 billion in 2024, USD 7.9 billion in 2026 and USD 16.85 billion in 2030.
Composition changes more than the total does. Software, at 25.99%, outgrows Hardware at 18.55%, and its share moves from 20% to 29%. Hardware stays the largest line throughout, at USD 4.224 billion in 2025 and USD 19.965 billion in 2034. Software and Services take share over the period; Hardware give it up while still growing in absolute terms.
The hardware architecture split puts Digital Spiking first, at USD 2.56 billion and 40% of revenue in 2025, rising to USD 10.89 billion and 30% in 2034. Photonic Neuromorphic grows faster at 28.37% against 17.45%, moving from 6% of revenue to 10% by 2034. It cuts the same total as the offering axis from a different commercial angle, so revenue does not add across the two.
North America is the largest region at 38% of 2025 revenue, worth USD 2.432 billion and reaching USD 11.979 billion by 2034. Asia Pacific follows at 32%, moving from USD 2.048 billion to USD 14.883 billion, and Latin America is the smallest at 3%. Share shifts toward Asia Pacific over the forecast period, so the regional split repays a close reading.
Behind these figures sit five regions, three offering lines and ten segmentation axes, each reported for every year from 2020 to 2034. The headline 2025 value is arrived at by triangulating published aggregates against category proxies, not by an independent count, and the same applies to the segment, regional and country breakdowns drawn from it.
Market Size, 2020–2034
USD BillionRevenue in USD Billion. Values up to 2025 are actuals; 2026–2034 are forecast.
Key Takeaways
- The global neuromorphic computing market moves from USD 1.6 billion in 2020 to USD 6.4 billion in 2025 and USD 36.3 billion by 2034, the forecast period compounding at 21% a year.
- Hardware is the largest offering line at USD 4.224 billion in 2025, a 66% share, reaching USD 19.965 billion and 55% of revenue by 2034.
- Fastest growth on the offering axis belongs to Software: 25.99% a year, USD 1.28 billion to USD 10.527 billion, and a share moving from 20% to 29%.
- The bull case puts 2034 revenue at USD 46.2 billion and the bear case at USD 25 billion, either side of the USD 36.3 billion base case, each with its own stated assumption in the full report.
- North America holds 38% of global revenue in 2025 at USD 2.432 billion, the largest of the five regions tracked, and reaches USD 11.979 billion by 2034.
- The United States accounts for 87.17% of North America in the base year, worth USD 2.12 billion in 2025 and reaching USD 10.35 billion by 2034, the worked country example carried through that region's chapters.
- Every line on all ten segmentation axes and in each of the five regions carries its own revenue, share and growth rate for all fifteen years, 2020 through 2034, on a 2025 base.
Market Trends
Revenue Share, By offering
Base year 2025Hardware leads with 66.0% of offering segment revenue.
Share of offering segment revenue, most recent base year.
Three movements define the forecast period in the global neuromorphic computing market: how the offering mix changes, where regional weight shifts, and the rate at which the total compounds.
None of them reverses the market's direction. Every line and every region grows in absolute terms across the period; the movement is in which of them captures the revenue added.
Software outpaces Hardware. Software grows at 25.99% across 2026-2034 against 18.55% for Hardware, the widest spread on the offering axis. By 2034 the two sit at 29% and 55% of revenue, against 20% and 66% in 2025. In absolute terms Software rises from USD 1.28 billion to USD 10.527 billion, while Hardware rises from USD 4.224 billion to USD 19.965 billion. Both grow; the gap is wide enough to reshape the mix inside a single forecast window.
Regional weight shifts toward Asia Pacific. Asia Pacific moves from 32% of revenue in 2025 to 41% in 2034, worth USD 2.048 billion rising to USD 14.883 billion. The offsetting side is North America at 38% moving to 33%, Europe at 22% moving to 18%, Latin America at 3% moving to 3%, Middle East and Africa at 5% moving to 5%, none of which contracts. That makes the regional split worth reading directly instead of scaling from the global rate: the same market rate produces different outcomes depending on where a supplier's revenue sits.
Growth compounds at 21% without a step change. Fifteen years of revenue run USD 1.6 billion in 2020, USD 4.85 billion in 2024, USD 6.4 billion in 2025, USD 7.9 billion in 2026, USD 16.85 billion in 2030 and USD 36.3 billion in 2034. Against 31.95% through the historical period, the 21% forecast rate is a continuation; no year in the series interrupts it. For a participant that makes planning a question of capturing a share of steady expansion instead of timing a discontinuity, and it is why the offering and regional mixes matter more to a forecast than the headline rate does.
Market Growth Factors
Software adds the most incremental growth
Market Drivers
3- 01Software adds the most incremental growth
Software compounds at 25.99% against 21% for the market, rising from USD 1.28 billion in 2025 to USD 10.527 billion in 2034 and from 20% of revenue to 29%. Because the spread to Hardware at 18.55% is this wide, the headline 21% is a weighted result, not a rate any single line achieves. Where a supplier sits on this axis therefore decides whether it grows with the market or below it.
- 02Regional weight, not regional count
The largest regional base is North America: USD 2.432 billion in 2025 at 38% of the global total, USD 11.979 billion by 2034, still 33%. Asia Pacific is next at 32% of revenue, USD 2.048 billion in 2025 and USD 14.883 billion in 2034. Most of the base and most of the growth sit in those two, and a plan spread evenly across regions therefore over-invests outside them.
- 03The trend is already in the record
USD 1.6 billion in 2020, USD 4.85 billion in 2024 and USD 6.4 billion in 2025: 31.95% compound growth before the forecast period even begins. The forecast period then runs at 21%, ending 2034 at USD 36.3 billion. Because the growth is already in the record and not only in the projection, the rate is held flat across the forecast instead of ramped, and the risk in the number sits in the mix assumptions, not in whether the market grows at all.
Growth drivers
| # | Growth driver | Impact | Gross contribution (USD Billion) | 2026-28 | 2029-31 | 2032-34 |
|---|---|---|---|---|---|---|
| 1 | Demand for low-power inference at the edge | High | +9.8 | High | High | High |
| 2 | Adoption of event-based sensing in automotive and industrial systems | High | +7.6 | Medium | High | High |
| 3 | Conversion of pilot programmes into commercial production | Medium-High | +6.6 | Medium | High | High |
| 4 | Government and defence research funding | Medium | +4.2 | High | Medium | Medium |
| 5 | Growth of cloud access and co-development services | Medium | +3 | Medium | Medium | Medium |
| 6 | Others | Low | +2.8 | Low | Low | Low |
| Total | +34 | |||||
Restraints
| # | Restraint | Impact | Estimated reduction (USD Billion) | 2026-28 | 2029-31 | 2032-34 |
|---|---|---|---|---|---|---|
| 1 | Immature software toolchains and programming models | Medium-High | −1.9 | High | Medium | Low |
| 2 | Competition from conventional AI accelerators at the edge | Medium | −1.4 | Medium | Medium | Medium |
| 3 | Manufacturing yield and scale of novel memory devices | Medium | −0.8 | Medium | Medium | Low |
| Total | −4.1 | |||||
Drivers contribute 34 USD Billion and restraints remove 4.1 USD Billion, a net 29.9 USD Billion, which is the revenue the market adds between the base year and 2034. Contributions are CDI estimates, apportioned so that they reconcile with the forecast rather than being read from it.
The 21% forecast rate rests on three things that can be measured separately: the size of the existing base, the mix shift on the offering axis, and where regional growth is concentrated.
Restraining Factors
Downside case: USD 25 billion by 2034, against USD 36.3 billion in the base case
Market Restraints
2- 01Downside case: USD 25 billion by 2034, against USD 36.3 billion in the base case
The study's downside path assumes qualification of memory-based devices slips, conventional edge accelerators close most of the power gap, and public research funding is cut, so fewer pilots convert to production, and ends 2034 at USD 25 billion against the USD 36.3 billion base case, the same USD 6.4 billion base year, a slower forecast period.
- 02The largest line is not the fastest
With 66% of 2025 revenue (USD 4.224 billion) Hardware is where most of the market sits, and it grows at only 18.55% against the market's 21%. Revenue still reaches USD 19.965 billion by 2034 and share still falls to 55%: a drag on the average, not a decline.
Market Opportunities
Where the forecast could be beaten
Market Opportunities
2- 01Where the forecast could be beaten
Most current automotive and consumer pilots reach production on schedule, memory-based devices reach acceptable yield early, and toolchains let conventional machine-learning teams adopt spiking hardware quickly. On that assumption the market reaches USD 46.2 billion by 2034 against USD 36.3 billion in the base case, from the same USD 6.4 billion in 2025.
- 02Software share moves from 20% to 29%
Software grows at 25.99% against 21% for the market, adding revenue from USD 1.28 billion in 2025 to USD 10.527 billion in 2034 and taking its share from 20% to 29%. It is the place on this axis where share changes hands at scale, so it is where an entrant can take position without displacing the incumbent in Hardware.
Market Challenges
The total depends on a single line
Market Challenges
2- 01The total depends on a single line
USD 4.224 billion of 2025 revenue sits in Hardware, 66% of the total, and it is still 55% at USD 19.965 billion nine years later. Anything that changes demand for it changes the headline number; nothing else on the axis carries that weight.
- 02Single-country exposure in North America
North America is worth USD 2.432 billion in 2025 and USD 2.12 billion of that is the United States; 87.17% of the region, reaching USD 10.35 billion in 2034. Read as a region it looks diversified; read by weight it is not, and the regional forecast inherits whatever happens in that one market.
Segmentation Analysis
10 axesSegmentation runs along ten axes: offering, hardware architecture, neuron model, deployment, application, sensing modality, power class, business model, technology maturity stage and end user. Each axis cuts the same total revenue along a different commercial dimension, so the splits are alternative views of one market, not additions to it.
All three offering lines expand in revenue terms over the forecast period. Share is the dividing line; two take it, the other cedes it.
By Offering · 3 segments
Scale in Hardware and Growth in Software Define the Offering Axis
- Largest Hardware · 66%
- Fastest Software · 26%
- Moves most Hardware · -11 pts
- Order by 2034 unchanged
| Segment | 2025 | Share | 2034 | Share | CAGR |
|---|---|---|---|---|---|
| Hardware | $4.22B | 66% | $19.96B | 55%-11 | 18.6% |
| Software | $1.28B | 20% | $10.53B | 29%+9 | 26% |
| Services | $0.90B | 14% | $5.81B | 16%+2 | 22.8% |
Hardware leads because every deployment starts with chips, modules or boards that must be bought before software or services have anything to run on. Software grows fastest as toolchains, compilers and spiking network libraries mature and buyers move from evaluation boards to production designs that need supported development environments. The order does not change: Hardware is still largest in 2034, and what moves is how much it holds. This is the axis the estimation prices in full, year by year, and the one the regional chapters cut against.
By Hardware Architecture · 5 segments
Digital Spiking Led by Hardware architecture in 2025, with Photonic Neuromorphic Growing Fastest
- Largest Digital Spiking · 40%
- Fastest Photonic Neuromorphic · 28.4%
- Moves most Digital Spiking · -10 pts
- Order by 2034 changes
| Segment | 2025 | Share | 2034 | Share | CAGR |
|---|---|---|---|---|---|
| Digital Spiking | $2.56B | 40% | $10.89B | 30%-10 | 17.4% |
| Analog and Mixed-Signal | $1.60B | 25% | $9.44B | 26%+1 | 21.8% |
| Memristor and In-Memory Computing | $0.90B | 14% | $7.62B | 21%+7 | 26.9% |
| Photonic Neuromorphic | $0.38B | 6% | $3.63B | 10%+4 | 28.4% |
| Hybrid and Other Architectures | $0.96B | 15% | $4.72B | 13%-2 | 19.4% |
Digital spiking designs lead because they use established CMOS flows and give buyers predictable tooling and supply. Memristor and in-memory computing grows fastest as device endurance and array yield improve and as buyers seek to remove data movement between memory and compute, the main source of energy cost in conventional accelerators. Revenue from software and services is attributed to the architecture it supports. The order does not change: Digital Spiking is still largest in 2034, and what moves is how much it holds.
By Neuron Model · 4 segments
Leaky Integrate-and-Fire Led by Neuron model in 2025, with Adaptive Exponential and Other Models Growing Fastest
- Largest Leaky Integrate-and-Fire · 55%
- Fastest Adaptive Exponential and Other Models · 25.4%
- Moves most Leaky Integrate-and-Fire · -9 pts
- Order by 2034 unchanged
| Segment | 2025 | Share | 2034 | Share | CAGR |
|---|---|---|---|---|---|
| Leaky Integrate-and-Fire | $3.52B | 55% | $16.70B | 46%-9 | 18.9% |
| Izhikevich | $1.15B | 18% | $6.90B | 19%+1 | 22% |
| Hodgkin-Huxley | $0.45B | 7% | $2.90B | 8%+1 | 23.1% |
| Adaptive Exponential and Other Models | $1.28B | 20% | $9.80B | 27%+7 | 25.4% |
Leaky integrate-and-fire leads because it is simple to implement in silicon, cheap in area and well supported by training methods. Adaptive exponential and other richer models grow fastest as designers trade circuit complexity for better temporal behaviour on speech, radar and biosignal workloads where simple models lose information. By 2034 Leaky Integrate-and-Fire is still ahead, making this a shift in weight, not a change of leader.
By Deployment · 3 segments
Edge Holds the Largest Deployment Share and Is Still the Quickest to Grow
- Largest Edge · 52%
- Fastest Edge · 23.7%
- Moves most Edge · +10 pts
- Order by 2034 unchanged
| Segment | 2025 | Share | 2034 | Share | CAGR |
|---|---|---|---|---|---|
| Edge | $3.33B | 52% | $22.51B | 62%+10 | 23.7% |
| Cloud and Data Center | $1.92B | 30% | $10.16B | 28%-2 | 20.3% |
| Research Clusters and Supercomputing | $1.15B | 18% | $3.63B | 10%-8 | 13.6% |
Edge leads because the main selling point of neuromorphic silicon is low power at the sensor, where battery and thermal limits rule out conventional accelerators. Edge also grows fastest as event-based sensors and always-on devices reach volume. Research clusters grow slowest because they depend on a limited set of funded programmes. The order does not change: Edge is still largest in 2034, and what moves is how much it holds.
By Application · 6 segments
Image and Video Processing Held the Dominant Share of the Application Segment in 2025
- Largest Image and Video Processing · 30%
- Fastest Robotics and Motion Control · 25.4%
- Moves most Robotics and Motion Control · +5 pts
- Order by 2034 changes
| Segment | 2025 | Share | 2034 | Share | CAGR |
|---|---|---|---|---|---|
| Image and Video Processing | $1.92B | 30% | $9.80B | 27%-3 | 19.9% |
| Signal Processing | $1.28B | 20% | $6.53B | 18%-2 | 19.9% |
| Data Processing and Optimization | $1.15B | 18% | $6.17B | 17%-1 | 20.5% |
| Robotics and Motion Control | $0.90B | 14% | $6.90B | 19%+5 | 25.4% |
| Anomaly and Predictive Maintenance | $0.64B | 10% | $4.36B | 12%+2 | 23.7% |
| Sensory and Olfactory Processing | $0.51B | 8% | $2.54B | 7%-1 | 19.5% |
Image and video processing leads because event-based vision is the most mature use and has the clearest advantage in latency and power. Robotics and motion control grows fastest as autonomous platforms need closed-loop sensing and control at low power, and as integrators move from lab prototypes to fielded machines. By 2034 Image and Video Processing is still ahead, making this a shift in weight, not a change of leader.
By Sensing Modality · 6 segments
Scale in Vision (Event-Based) and Growth in Radar and Lidar Define the Sensing modality Axis
- Largest Vision (Event-Based) · 42%
- Fastest Radar and Lidar · 26.1%
- Moves most Vision (Event-Based) · -6 pts
- Order by 2034 unchanged
| Segment | 2025 | Share | 2034 | Share | CAGR |
|---|---|---|---|---|---|
| Vision (Event-Based) | $2.69B | 42% | $13.07B | 36%-6 | 19.2% |
| Audio | $1.28B | 20% | $7.26B | 20% | 21.3% |
| Tactile and Haptic | $0.51B | 8% | $3.27B | 9%+1 | 22.9% |
| Radar and Lidar | $0.77B | 12% | $6.17B | 17%+5 | 26.1% |
| Biosignal (EEG, ECG, EMG) | $0.70B | 11% | $4.36B | 12%+1 | 22.4% |
| Chemical and Olfactory | $0.45B | 7% | $2.18B | 6%-1 | 19.2% |
Event-based vision leads because dynamic vision sensors exist as commercial products and pair naturally with spiking processors. Radar and lidar grows fastest as automotive and defence programmes look for sparse, low-latency processing of point and return data, where conventional pipelines spend most of their power on frames that carry little change. Vision (Event-Based) remains the largest line through 2034, so the axis changes in proportion, not in order.
By Power Class · 4 segments
Low Power (1 mW to 1 W) Held the Dominant Share of the Power class Segment in 2025
- Largest Low Power (1 mW to 1 W) · 38%
- Fastest Ultra-Low Power (Below 1 mW) · 23.5%
- Moves most Ultra-Low Power (Below 1 mW) · +6 pts
- Order by 2034 changes
| Segment | 2025 | Share | 2034 | Share | CAGR |
|---|---|---|---|---|---|
| Ultra-Low Power (Below 1 mW) | $2.18B | 34% | $14.52B | 40%+6 | 23.5% |
| Low Power (1 mW to 1 W) | $2.43B | 38% | $13.07B | 36%-2 | 20.5% |
| Mid Power (1 W to 10 W) | $1.28B | 20% | $5.81B | 16%-4 | 18.3% |
| High Power (Above 10 W) | $0.51B | 8% | $2.90B | 8% | 21.3% |
Low power devices lead because they cover the widest set of wearable, industrial and embedded designs where a modest budget is available. Ultra-low power grows fastest as always-on sensing in hearing, wearable and sensor-node products demands microwatt operation that conventional low-power microcontrollers cannot meet. High power parts are held to a narrow set of datacenter and research uses. By 2034 the largest line is Ultra-Low Power (Below 1 mW) and no longer Low Power (1 mW to 1 W), the one axis here where the order actually changes.
By Business Model · 4 segments
Cloud and Access Services Outpaces the Axis While Packaged Chips and Modules Holds the Largest Share
- Largest Packaged Chips and Modules · 55%
- Fastest Cloud and Access Services · 28.6%
- Moves most Packaged Chips and Modules · -10 pts
- Order by 2034 changes
| Segment | 2025 | Share | 2034 | Share | CAGR |
|---|---|---|---|---|---|
| Packaged Chips and Modules | $3.52B | 55% | $16.34B | 45%-10 | 18.6% |
| IP Licensing | $0.77B | 12% | $5.45B | 15%+3 | 24.3% |
| Cloud and Access Services | $0.83B | 13% | $7.99B | 22%+9 | 28.6% |
| Custom and Co-Development Programs | $1.28B | 20% | $6.53B | 18%-2 | 19.9% |
Packaged chips and modules lead because most buyers still purchase physical parts for evaluation and early products. Cloud and access services grow fastest as teams that lack board-level integration skills rent neuromorphic compute to test workloads before committing to silicon. Licensing grows steadily as larger chip makers embed spiking cores in their own products. By 2034 Packaged Chips and Modules is still ahead, making this a shift in weight, not a change of leader.
By Technology Maturity Stage · 3 segments
Commercial Production Devices Outpaces the Axis While Research and Prototype Systems Holds the Largest Share
- Largest Research and Prototype Systems · 40%
- Fastest Commercial Production Devices · 33.7%
- Moves most Commercial Production Devices · +35 pts
- Order by 2034 changes
| Segment | 2025 | Share | 2034 | Share | CAGR |
|---|---|---|---|---|---|
| Research and Prototype Systems | $2.56B | 40% | $4.36B | 12%-28 | 6.1% |
| Pilot and Evaluation Deployments | $2.24B | 35% | $10.16B | 28%-7 | 18.3% |
| Commercial Production Devices | $1.60B | 25% | $21.78B | 60%+35 | 33.7% |
Research and prototype systems lead today because most spending still funds programmes that explore the technology. Commercial production devices grow fastest as designs clear qualification, supply agreements are signed and volume programmes replace one-off builds. Research spending keeps growing but loses share steadily as products ship. Leadership changes hands: Commercial Production Devices is the largest line by 2034, not Research and Prototype Systems.
By End User · 9 segments
By End User
- Largest Automotive and Transportation · 16%
- Fastest Automotive and Transportation · 25%
- Moves most Academic and Research Institutions · -9 pts
- Order by 2034 changes
| Segment | 2025 | Share | 2034 | Share | CAGR |
|---|---|---|---|---|---|
| Automotive and Transportation | $1.02B | 16% | $7.62B | 21%+5 | 25% |
| Consumer Electronics | $0.90B | 14% | $6.53B | 18%+4 | 24.7% |
| Aerospace and Defense | $0.96B | 15% | $4.72B | 13%-2 | 19.4% |
| Healthcare and Medical Devices | $0.64B | 10% | $4.36B | 12%+2 | 23.7% |
| Industrial and Manufacturing | $0.90B | 14% | $5.81B | 16%+2 | 23.1% |
| IT and Telecommunications | $0.77B | 12% | $3.63B | 10%-2 | 18.8% |
| BFSI | $0.19B | 3% | $1.09B | 3% | 21.3% |
| Energy and Utilities | $0.26B | 4% | $1.45B | 4% | 21.3% |
| Academic and Research Institutions | $0.77B | 12% | $1.09B | 3%-9 | 4% |
2025 to 2034 revenue and share by line: Automotive and Transportation USD 1.024 billion to USD 7.623 billion (16% in 2025), Aerospace and Defense USD 0.96 billion to USD 4.719 billion (15% in 2025), Consumer Electronics USD 0.896 billion to USD 6.534 billion (14% in 2025), Industrial and Manufacturing USD 0.896 billion to USD 5.808 billion (14% in 2025), IT and Telecommunications USD 0.768 billion to USD 3.63 billion (12% in 2025), Academic and Research Institutions USD 0.768 billion to USD 1.089 billion (12% in 2025), Healthcare and Medical Devices USD 0.64 billion to USD 4.356 billion (10% in 2025), Energy and Utilities USD 0.256 billion to USD 1.452 billion (4% in 2025), BFSI USD 0.192 billion to USD 1.089 billion (3% in 2025). Automotive and Transportation Holds the Largest End user Share and Is Still the Quickest to Grow Automotive and transportation leads by 2034 because driver monitoring, in-cabin sensing and perception programmes carry the largest design pipelines and the longest production runs once qualified. Consumer electronics grows quickly on always-on sensing in wearables and phones. Academic institutions lose share as commercial buyers take over from funded research. By 2034 Automotive and Transportation is still ahead, making this a shift in weight, not a change of leader.
Regional Insights
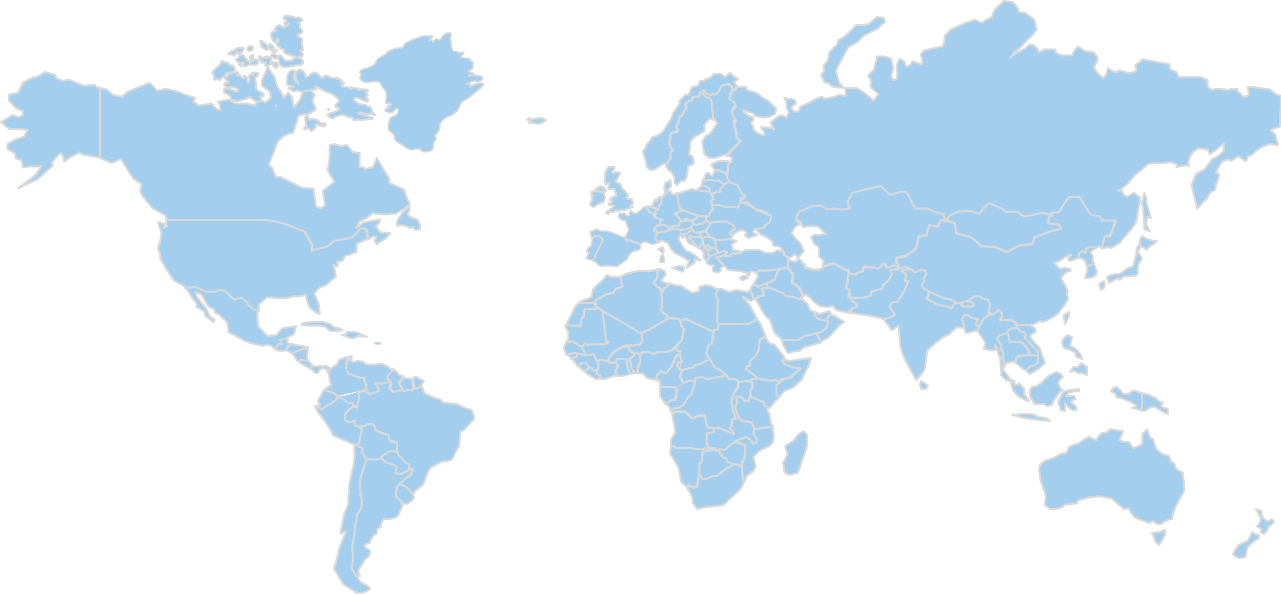
Regional Revenue Share
Base year 2025Share of global revenue in the base year.
Only the leading region's share is published outside the report; pins mark the region, not a specific country.
North America Market Analysis
The largest region covered — 5 points of share move elsewhere by 2034, while revenue still grows 4.9×.
- Rank 1 of 5
- 2025 share 38%
- By 2034 33%
- Revenue $2.43B → $11.98B
38% of the global neuromorphic computing market sits in North America in 2025, worth USD 2.432 billion rising to USD 11.979 billion in 2034. By revenue it sits first across the study, and the ranking does not change between 2025 and 2034.
Share settles at 33% in 2034, while nothing contracts here; other regions simply grow faster, which shows up as relative weight, not as falling revenue.
Within the region the offering split tracks the global one; 66% of 2025 revenue in Hardware, fastest growth of 25.99% in Software. North America is reported axis by axis and country by country in the full study.
United States
Sets the pace for North America at 87.2% of it, growing 4.9×.
- In region 1 of 2
- Of region 87.2%
- Of global 33.1%
- Revenue $2.12B → $10.35B
USD 2.12 billion of North America's 2025 revenue is generated in the United States, the region's largest market, reaching USD 10.35 billion by 2034. At 87.17% of regional revenue in the base year it is not one market among several, the region's trajectory is largely this country's trajectory. Regional revenue of USD 2.432 billion in 2025 and USD 11.979 billion in 2034 sits around it, and it is the country used wherever the full report cuts a figure by geography.
the United States buys along the same lines as the market globally; Hardware first at 66% of 2025 revenue and 55% in 2034, Software fastest at 25.99% on a share moving from 20% to 29%. Because the country carries 87.17% of North America, a movement in its own mix shows up in the regional totals instead of being averaged away by neighbouring markets. The United States carries its own offering breakdown in the full report.
Neuromorphic processors in the United States are treated as general electronic components and are not subject to a dedicated approval regime. The Federal Communications Commission governs unintentional and intentional radiators under its equipment authorization rules, so finished boards and modules that emit radio frequency energy need the relevant authorization and labelling. Export of advanced computing items falls under the Export Administration Regulations, administered by the Bureau of Industry and Security, which can require licences depending on performance and destination. Where a chip is built into a medical device, automobile or aircraft, the Food and Drug Administration, the National Highway Traffic Safety Administration or the Federal Aviation Administration regulates the end product, and the supplier carries the component evidence.
In the United States the field is Intel Corporation, International Business Machines Corporation, BrainChip Holdings Ltd, Samsung Electronics Co., Ltd., SK hynix Inc., Qualcomm Technologies, Inc., SynSense AG, Innatera Nanosystems B.V., Prophesee S.A., Sony Group Corporation, GrAI Matter Labs, Hewlett Packard Enterprise Company, HRL Laboratories, LLC, Applied Brain Research Inc., General Vision, Inc., Knowm Inc., Rain AI, Polyn Technology Ltd., aiCTX AG, Mythic, Inc., Numenta, Inc., Weebit Nano Ltd., SpiNNcloud Systems GmbH, Opteran Technologies Ltd., Syntiant Corp., Cerebras Systems Inc., iniVation AG and Lightmatter, Inc.. The commercially relevant division is 66% of 2025 revenue in Hardware, where the volume is, against 25.99% growth in Software, where share moves. Country-level positioning and shares for each of these companies are part of the full report, not of this summary.
Canada
2nd-largest in North America, growing 5.2×.
- In region 2 of 2
- Of region 9.9%
- Of global 3.8%
- Revenue $0.24B → $1.25B
Canada is sized at USD 0.24 billion in 2025, rising to USD 1.25 billion by 2034; 3.75% of global revenue and 9.87% of North America. It is reported separately from the United States across every segmentation axis in the full report.
Europe Market Analysis
The 3rd-largest region covered — 4 points of share move elsewhere by 2034, while revenue still grows 4.6×.
- Rank 3 of 5
- 2025 share 22%
- By 2034 18%
- Revenue $1.41B → $6.53B
Europe holds 22% of the global neuromorphic computing market in 2025, worth USD 1.408 billion on the way to USD 6.534 billion by 2034. That makes it the third-largest region covered, in 2025 and again in 2034.
Its share moves to 18% by 2034, though revenue still rises throughout; the shift is in the region's weight against faster-growing ones, which is not the same as weakening demand.
Segment composition follows the global pattern: Hardware largest at 66% of 2025 revenue, Software fastest at 25.99%. The full report breaks Europe out along every axis and by country.
Germany
The largest market in Europe, growing 4.8×.
- In region 1 of 3
- Of region 25.6%
- Of global 5.6%
- Revenue $0.36B → $1.72B
USD 0.36 billion of Europe's 2025 revenue is generated in Germany, the region's largest market, reaching USD 1.72 billion by 2034. Its 25.57% of base-year regional revenue leads the region, though enough sits elsewhere that Europe is not a proxy for it. Set against USD 1.408 billion and USD 6.534 billion for the region, it is why this market, and not a smaller one, is the one reported in full.
Germany buys along the same lines as the market globally; Hardware first at 66% of 2025 revenue and 55% in 2034, Software fastest at 25.99% on a share moving from 20% to 29%. Since 25.57% of Europe's revenue is generated here, the regional numbers inherit this market's mix instead of smoothing it out. Revenue by offering for Germany is reported separately in the full report.
In Germany, neuromorphic hardware follows the European Union product framework, since national law largely implements it. Suppliers affix the CE marking after declaring conformity with the EU Electromagnetic Compatibility Directive, the Low Voltage Directive where it applies, and the Radio Equipment Directive for wireless modules. The RoHS Directive restricts hazardous substances, and the WEEE regime sets take-back duties, with the Federal Network Agency overseeing radio and electromagnetic matters in the market. Software and systems that perform automated decision making can also fall under the EU Artificial Intelligence Act as a high-risk use. Harmonised European standards give a presumption of conformity, and technical documentation must be retained for inspection.
The suppliers tracked in this study (Intel Corporation, International Business Machines Corporation, BrainChip Holdings Ltd, Samsung Electronics Co., Ltd., SK hynix Inc., Qualcomm Technologies, Inc., SynSense AG, Innatera Nanosystems B.V., Prophesee S.A., Sony Group Corporation, GrAI Matter Labs, Hewlett Packard Enterprise Company, HRL Laboratories, LLC, Applied Brain Research Inc., General Vision, Inc., Knowm Inc., Rain AI, Polyn Technology Ltd., aiCTX AG, Mythic, Inc., Numenta, Inc., Weebit Nano Ltd., SpiNNcloud Systems GmbH, Opteran Technologies Ltd., Syntiant Corp., Cerebras Systems Inc., iniVation AG and Lightmatter, Inc.) compete in Germany across the offering lines above. Volume sits in Hardware at 66% of 2025 revenue; movement sits in Software at 25.99% growth. The commercial size of that position is USD 1.408 billion in 2025, moving to USD 6.534 billion by 2034 across the forecast period.
United Kingdom
2nd-largest in Europe, growing 4.8×.
- In region 2 of 3
- Of region 23.4%
- Of global 5.2%
- Revenue $0.33B → $1.60B
Within Europe, the United Kingdom accounts for 23.44% of regional revenue and 5.16% of the global total, worth USD 0.33 billion in 2025 and USD 1.6 billion by 2034.
France
3rd-largest in Europe, growing 4.8×.
- In region 3 of 3
- Of region 15.6%
- Of global 3.4%
- Revenue $0.22B → $1.05B
France is sized at USD 0.22 billion in 2025, rising to USD 1.05 billion by 2034; 3.44% of global revenue and 15.63% of Europe. It is reported separately from Germany across every segmentation axis in the full report.
Asia Pacific Market Analysis
The 2nd-largest region covered, and the one gaining the most — it picks up 9 points of share by 2034, while revenue still grows 7.3×.
- Rank 2 of 5
- 2025 share 32%
- By 2034 41%
- Revenue $2.05B → $14.88B
32% of the global neuromorphic computing market sits in Asia Pacific in 2025, worth USD 2.048 billion on the way to USD 14.883 billion by 2034. It is a leading region on this axis, second by revenue throughout the period.
41% of global revenue sits here by 2034, up from the 2025 level, because it outgrows the market's 21%; the revenue added here is disproportionate to where the region started.
Segment composition follows the global pattern: Hardware largest at 66% of 2025 revenue, Software fastest at 25.99%. Revenue for Asia Pacific is broken out by every segmentation axis and by country in the full report.
China
The largest market in Asia Pacific, growing 7.6×.
- In region 1 of 3
- Of region 38.1%
- Of global 12.2%
- Revenue $0.78B → $5.95B
The largest single market in Asia Pacific is China, at USD 0.78 billion in 2025 and USD 5.95 billion in 2034. It accounts for 38.09% of regional revenue in the base year, the largest single share without dominating the region outright. Set against USD 2.048 billion and USD 14.883 billion for the region, it is why this market, and not a smaller one, is the one reported in full.
Composition here matches the global split: the largest line is Hardware at 66% of 2025 revenue, easing to 55% by 2034, and the fastest is Software at 25.99%, from 20% to 29%. Its 38.09% weight in Asia Pacific means those movements carry straight into the regional totals. China carries its own offering breakdown in the full report.
Neuromorphic chips sold in China sit within the general electronics and integrated circuit regime. The State Administration for Market Regulation administers product quality rules and the China Compulsory Certification scheme, which applies when a chip is built into a listed finished product such as a network device or an appliance. The Ministry of Industry and Information Technology oversees radio transmission equipment approval and sector policy for integrated circuits. Imports and exports pass through customs controls, and certain dual-use items need export licences from the Ministry of Commerce. Data security and cybersecurity laws, enforced by the Cyberspace Administration of China, add obligations when the hardware supports regulated data processing or algorithm services.
The suppliers tracked in this study (Intel Corporation, International Business Machines Corporation, BrainChip Holdings Ltd, Samsung Electronics Co., Ltd., SK hynix Inc., Qualcomm Technologies, Inc., SynSense AG, Innatera Nanosystems B.V., Prophesee S.A., Sony Group Corporation, GrAI Matter Labs, Hewlett Packard Enterprise Company, HRL Laboratories, LLC, Applied Brain Research Inc., General Vision, Inc., Knowm Inc., Rain AI, Polyn Technology Ltd., aiCTX AG, Mythic, Inc., Numenta, Inc., Weebit Nano Ltd., SpiNNcloud Systems GmbH, Opteran Technologies Ltd., Syntiant Corp., Cerebras Systems Inc., iniVation AG and Lightmatter, Inc.) compete in China across the offering lines above. The commercially relevant division is 66% of 2025 revenue in Hardware, where the volume is, against 25.99% growth in Software, where share moves. The commercial size of that position is USD 2.048 billion in 2025, moving to USD 14.883 billion by 2034 across the forecast period.
Japan
2nd-largest in Asia Pacific, growing 6.3×.
- In region 2 of 3
- Of region 25.4%
- Of global 8.1%
- Revenue $0.52B → $3.30B
Within Asia Pacific, Japan accounts for 25.39% of regional revenue and 8.13% of the global total, worth USD 0.52 billion in 2025 and USD 3.3 billion by 2034.
South Korea
3rd-largest in Asia Pacific, growing 7.2×.
- In region 3 of 3
- Of region 19.5%
- Of global 6.3%
- Revenue $0.40B → $2.90B
Within Asia Pacific, South Korea accounts for 19.53% of regional revenue and 6.25% of the global total, worth USD 0.4 billion in 2025 and USD 2.9 billion by 2034.
Latin America Market Analysis
The 5th-largest region covered, holding its share flat through 2034, while revenue still grows 5.7×.
- Rank 5 of 5
- 2025 share 3%
- By 2034 3%
- Revenue $0.19B → $1.09B
3% of the global neuromorphic computing market sits in Latin America in 2025, worth USD 0.192 billion with USD 1.089 billion projected for 2034. It is a marginal region on this axis, fifth by revenue throughout the period.
Its share moves to 3% by 2034, though revenue still rises throughout; the shift is in the region's weight against faster-growing ones, which is not the same as weakening demand.
The offering mix reported at global level applies here, with Hardware the largest line at 66% of 2025 revenue and Software the fastest-growing at 25.99%. Per-axis and per-country detail for Latin America sits in the full report.
Brazil
The largest market in Latin America, growing 5.8×.
- In region 1 of 2
- Of region 41.7%
- Of global 1.3%
- Revenue $0.08B → $0.46B
USD 0.08 billion of Latin America's 2025 revenue is generated in Brazil, the region's largest market, reaching USD 0.46 billion by 2034. 41.67% of the region in the base year makes it the largest market here without making it the region. Against regional totals of USD 0.192 billion in 2025 and USD 1.089 billion in 2034, it is the country the full report breaks out in detail.
The offering pattern in Brazil is the global one: 66% of 2025 revenue in Hardware, 55% by 2034, against 25.99% growth in Software taking it from 20% to 29%. Because the country carries 41.67% of Latin America, a movement in its own mix shows up in the regional totals instead of being averaged away by neighbouring markets. The full report reports Brazil by offering separately.
In Brazil, a neuromorphic computing product enters the market as electronic equipment without a dedicated category. The National Telecommunications Agency, Anatel, requires homologation of any product with a radio or telecommunications function, and the approval is shown on the label. Electrical safety certification for listed equipment is organised through the national metrology institute, Inmetro, and its accredited bodies. Customs clearance runs through the Federal Revenue Service, and local import registration is needed. Brazilian technical standards bodies, led by the Brazilian Association of Technical Standards, publish the applicable norms. The General Data Protection Law applies to systems that process personal data using such hardware, and the consumer code governs the warranty and labelling duties.
Intel Corporation, International Business Machines Corporation, BrainChip Holdings Ltd, Samsung Electronics Co., Ltd., SK hynix Inc., Qualcomm Technologies, Inc., SynSense AG, Innatera Nanosystems B.V., Prophesee S.A., Sony Group Corporation, GrAI Matter Labs, Hewlett Packard Enterprise Company, HRL Laboratories, LLC, Applied Brain Research Inc., General Vision, Inc., Knowm Inc., Rain AI, Polyn Technology Ltd., aiCTX AG, Mythic, Inc., Numenta, Inc., Weebit Nano Ltd., SpiNNcloud Systems GmbH, Opteran Technologies Ltd., Syntiant Corp., Cerebras Systems Inc., iniVation AG and Lightmatter, Inc. are the suppliers covered in Brazil. The commercially relevant division is 66% of 2025 revenue in Hardware, where the volume is, against 25.99% growth in Software, where share moves. A supplier weighted toward Latin America is competing over a base of USD 0.192 billion in 2025, reaching USD 1.089 billion by 2034 on the trajectory this study models.
Mexico
2nd-largest in Latin America, growing 5.8×.
- In region 2 of 2
- Of region 25%
- Of global 0.8%
- Revenue $0.05B → $0.28B
Within Latin America, Mexico accounts for 25% of regional revenue and 0.75% of the global total, worth USD 0.048 billion in 2025 and USD 0.28 billion by 2034.
Middle East and Africa Market Analysis
The 4th-largest region covered, holding its share flat through 2034, while revenue still grows 5.7×.
- Rank 4 of 5
- 2025 share 5%
- By 2034 5%
- Revenue $0.32B → $1.81B
5% of the global neuromorphic computing market sits in Middle East and Africa in 2025, worth USD 0.32 billion on the way to USD 1.815 billion by 2034. Among the five regions it ranks fourth by revenue in both years.
5% of global revenue sits here in 2034, below the 2025 level, and the region keeps growing in absolute terms while others expand faster, a change in relative weight, not a decline in demand.
Hardware leads here as it does globally, at 66% of 2025 revenue, and Software again grows fastest at 25.99%. Per-axis and per-country detail for Middle East and Africa sits in the full report.
Israel
The largest market in Middle East and Africa, growing 5.8×.
- In region 1 of 2
- Of region 31.3%
- Of global 1.6%
- Revenue $0.10B → $0.58B
The largest single market in Middle East and Africa is Israel, at USD 0.1 billion in 2025 and USD 0.58 billion in 2034. Its 31.25% of base-year regional revenue leads the region, though enough sits elsewhere that Middle East and Africa is not a proxy for it. Regional revenue of USD 0.32 billion in 2025 and USD 1.815 billion in 2034 sits around it, and it is the country used wherever the full report cuts a figure by geography.
Israel buys along the same lines as the market globally; Hardware first at 66% of 2025 revenue and 55% in 2034, Software fastest at 25.99% on a share moving from 20% to 29%. Its 31.25% weight in Middle East and Africa means those movements carry straight into the regional totals. Israel carries its own offering breakdown in the full report.
Israel has no regime specific to neuromorphic processors, so a supplier works within the rules for electronic equipment. The Standards Institution of Israel sets mandatory standards for electrical safety and electromagnetic compatibility on listed products, with conformity shown through its testing and marking procedures. The Ministry of Communications regulates radio and telecommunications equipment and requires type approval for wireless devices before they are sold. Imports are cleared through the Israel Tax Authority customs division. Because the technology has defence and dual-use applications, exports are controlled by the Ministry of Defense and the Ministry of Economy under Israeli export control law, which may require a licence. The Privacy Protection Authority oversees personal data use in deployed systems.
Intel Corporation, International Business Machines Corporation, BrainChip Holdings Ltd, Samsung Electronics Co., Ltd., SK hynix Inc., Qualcomm Technologies, Inc., SynSense AG, Innatera Nanosystems B.V., Prophesee S.A., Sony Group Corporation, GrAI Matter Labs, Hewlett Packard Enterprise Company, HRL Laboratories, LLC, Applied Brain Research Inc., General Vision, Inc., Knowm Inc., Rain AI, Polyn Technology Ltd., aiCTX AG, Mythic, Inc., Numenta, Inc., Weebit Nano Ltd., SpiNNcloud Systems GmbH, Opteran Technologies Ltd., Syntiant Corp., Cerebras Systems Inc., iniVation AG and Lightmatter, Inc. are the suppliers covered in Israel. Hardware, at 66% of 2025 revenue, is where the volume sits, and Software, growing at 25.99%, is where position changes hands over the forecast period. A supplier weighted toward Middle East and Africa is competing over a base of USD 0.32 billion in 2025 reaching USD 1.815 billion by 2034, 5% of global revenue at the start of that period.
United Arab Emirates
2nd-largest in Middle East and Africa, growing 6.3×.
- In region 2 of 2
- Of region 21.9%
- Of global 1.1%
- Revenue $0.07B → $0.44B
The United Arab Emirates is sized at USD 0.07 billion in 2025, rising to USD 0.44 billion by 2034; 1.09% of global revenue and 21.88% of Middle East and Africa. It is reported separately from Israel across every segmentation axis in the full report.
Request this sample to see the full data tables and segment-level detail behind this analysis.
Report Coverage
This report assesses the market across every segment, with revenue and a growth rate for each line in each year of the study period. It covers the drivers, trends, opportunities, restraints and challenges shaping growth, the competitive landscape and the companies profiled, and the research methodology behind every estimate. Segmentation is reported by offering, hardware architecture, neuron model, deployment, application, sensing modality, power class, business model, technology maturity stage, end user, and regional analysis covers North America, Europe, Asia Pacific, Latin America, Middle East and Africa, each broken out by country.
Competitive Landscape
Position on the Offering Axis Decides Competitive Standing
Suppliers in scope: Intel Corporation, International Business Machines Corporation, BrainChip Holdings Ltd, Samsung Electronics Co., Ltd., SK hynix Inc., Qualcomm Technologies, Inc., SynSense AG, Innatera Nanosystems B.V., Prophesee S.A., Sony Group Corporation, GrAI Matter Labs, Hewlett Packard Enterprise Company, HRL Laboratories, LLC, Applied Brain Research Inc., General Vision, Inc., Knowm Inc., Rain AI, Polyn Technology Ltd., aiCTX AG, Mythic, Inc., Numenta, Inc., Weebit Nano Ltd., SpiNNcloud Systems GmbH, Opteran Technologies Ltd., Syntiant Corp., Cerebras Systems Inc., iniVation AG and Lightmatter, Inc..
The offering axis, not the regional one, is where competition happens. Volume sits in Hardware, USD 4.224 billion and 66% of 2025 revenue, 55% by 2034, which is also where an incumbent is hardest to dislodge. Movement is concentrated in Software; 25.99% growth, against 18.55% at the other end of the axis in Hardware. The two rarely sit with the same supplier, and that is the reason a USD 6.4 billion market is not already consolidated.
Suppliers separate on the strength of their software stack, access to fabrication capacity for new memory and analog processes, and the ability to win design slots that last through a multi-year product cycle. Large semiconductor and computing groups hold advantages in foundry relationships, qualification experience, funding for long research programmes and existing customer channels. Smaller and regional specialists compete on extreme power efficiency, event-based sensor pairing, narrow application focus and willingness to co-develop with a single customer. Intellectual property licensing lets small designers reach volume through partners, while tooling that lets existing machine-learning teams port models quickly is a decisive purchase factor.
The regional picture sets the entry cost: 38% of revenue is in North America and 32% in Asia Pacific, so a credible global position requires both, while Latin America at 3% can be served opportunistically.
Per-company profiles, financials, share and development history are in the full report and not here.
List of Key Neuromorphic Computing Market Companies Profiled
28 companies profiled. Company profiles, including financials, product portfolios and recent developments, are part of the full report.
- Intel Corporation(United States)
- International Business Machines Corporation(United States)
- BrainChip Holdings Ltd(Australia)
- Samsung Electronics Co., Ltd.(South Korea)
- SK hynix Inc.(South Korea)
- Qualcomm Technologies, Inc.(United States)
- SynSense AG(Switzerland)
- Innatera Nanosystems B.V.(Netherlands)
- Prophesee S.A.(France)
- Sony Group Corporation(Japan)
- GrAI Matter Labs(France)
- Hewlett Packard Enterprise Company(United States)
- HRL Laboratories, LLC(United States)
- Applied Brain Research Inc.(Canada)
- General Vision, Inc.(United States)
- Knowm Inc.(United States)
- Rain AI(United States)
- Polyn Technology Ltd.(Israel)
- aiCTX AG(Switzerland)
- Mythic, Inc.(United States)
- Numenta, Inc.(United States)
- Weebit Nano Ltd.(Israel)
- SpiNNcloud Systems GmbH(Germany)
- Opteran Technologies Ltd.(United Kingdom)
- Syntiant Corp.(United States)
- Cerebras Systems Inc.(United States)
- iniVation AG(Switzerland)
- Lightmatter, Inc.(United States)
Geographic Coverage
Every market below is broken out separately in the report.
North America
3Europe
8Asia Pacific
12Latin America
3Middle East and Africa
4Key Insights
Report Scope
Study parameters & segmentationThis study covers market size and forecasts over the 2020–2034 period, segmentation across 10 axes (Offering, Hardware Architecture, Neuron Model, Deployment, Application, Sensing Modality, Power Class, Business Model, Technology Maturity Stage, End User), regional analysis for 5 regions and their constituent countries, a competitive landscape profiling 28 key companies, and the research methodology behind every estimate.
Segmentation
10 axes + regionQuestions This Report Answers
6 questionsWhat is the market size and growth rate, globally and by region?
How is the market segmented, and which segments lead?
Which regions and countries are covered, and how do they compare?
What are the key drivers, restraints, opportunities and challenges?
Who are the leading companies operating in this market?
What trends are expected to shape the market through the forecast period?
Frequently Asked Questions
01What is the Neuromorphic Computing Market projected to reach?
USD 36.3 USD Billion by 2034, CAGR 21%
02What years does this report cover?
Study period 2020–2034, base year 2025, historical data 2020-2024, forecast period 2026-2034.
03Which regions are covered?
North America, Europe, Asia Pacific, Latin America, Middle East and Africa.
04Which region accounted for the largest market share?
North America leads with 38% of global revenue through 2034.
05Which segment leads the market?
Hardware is the largest line by offering, at 66% of revenue in 2025.
06Who are the key companies profiled?
Intel Corporation, International Business Machines Corporation, BrainChip Holdings Ltd, Samsung Electronics Co., Ltd., SK hynix Inc., Qualcomm Technologies, Inc., SynSense AG, Innatera Nanosystems B.V., Prophesee S.A., Sony Group Corporation, GrAI Matter Labs, Hewlett Packard Enterprise Company, HRL Laboratories, LLC, Applied Brain Research Inc., General Vision, Inc., Knowm Inc., Rain AI, Polyn Technology Ltd., aiCTX AG, Mythic, Inc., Numenta, Inc., Weebit Nano Ltd., SpiNNcloud Systems GmbH, Opteran Technologies Ltd., Syntiant Corp., Cerebras Systems Inc., iniVation AG, Lightmatter, Inc.. Full profiles are part of the paid report.
07Can the segmentation be customized?
Yes. Custom data cuts by geography, segment, or competitor set are available on request.
Why choose CDI
Need this report shaped around your question?
The scope isn't fixed. Tell us what your team needs that the standard edition doesn't cover, and an analyst will come back on what can be adjusted and how long it takes, before you commit to anything.
Most licences include 30–60 hours of customization at no extra cost. See what each licence includes
Additional Companies
Add competitors, suppliers or the peer set you benchmark against to the companies already covered.
Deeper Competitive View
Sharpen the landscape work around your own position: product line, channel, or a named shortlist of rivals.
Extra Segment Splits
Break the market down along an axis the standard scope doesn't cut it by, or go a level deeper inside one.
Application Focus
Narrow the analysis to the specific use cases and end users your team actually sells into.
Different Time Frame
Move the base year, or widen the historical and forecast windows the study is built on.
Country-Level Detail
Go below region level into the individual countries that matter to you, rather than the standard geography split.