
Microgreens MarketSize, Share & Industry Analysis, 2026-2034By TypeBy Farming MethodBy Growing MediumBy FormBy Distribution ChannelBy End UserBy ApplicationBy NatureBy Packaging FormatBy Seed SourceBy Grower Scale
Full title & scope — all 11 axes with their segments
Microgreens Market Size, Share & Industry Analysis, By Type (Broccoli, Arugula, Radish, Pea Shoots, Basil, Sunflower, Cabbage and Kale, Other Varieties), By Farming Method (Indoor Vertical Farming, Greenhouse, Outdoor/Open Field, Container/Modular Farms), By Growing Medium (Soil, Peat Moss, Coco Coir, Hydroponic Mats, Water-Only/Seed Tray), By Form (Fresh/Live Tray, Cut and Packaged, Processed), By Distribution Channel (Supermarkets and Hypermarkets, Specialty and Natural Food Stores, Online Retail, Farmers Markets and Direct Sales, Foodservice Distributors), By End User (Household/Retail Consumers, Restaurants and Hotels, Catering and Institutional, Food Processors), By Application (Garnishing and Plating, Salads and Sandwiches, Smoothies and Juices, Soups and Cooked Dishes, Nutraceutical Ingredients), By Nature (Conventional, Organic), By Packaging Format (Plastic Clamshells, Compostable Containers, Pouches and Bags, Live Trays, Bulk Packs), By Seed Source (Conventional Seed, Organic Certified Seed, Non-GMO Verified Seed), By Grower Scale (Large Commercial Growers, Small and Medium Growers, Home and Hobby Growers), and Regional Forecast, 2026-2034
Market outlook, key takeaways, drivers and challenges for the report period.
- 01By TypeBroccoli · Arugula · Radish
- 02By Farming MethodIndoor Vertical Farming · Greenhouse · Outdoor/Open Field
- 03By Growing MediumSoil · Peat Moss · Coco Coir
- 04By FormFresh/Live Tray · Cut and Packaged · Processed
- 05By Distribution ChannelSupermarkets and Hypermarkets · Specialty and Natural Food Stores · Online Retail
- 06By End UserHousehold/Retail Consumers · Restaurants and Hotels · Catering and Institutional
- 07By ApplicationGarnishing and Plating · Salads and Sandwiches · Smoothies and Juices
- 08By NatureConventional · Organic
- 09By Packaging FormatPlastic Clamshells · Compostable Containers · Pouches and Bags
- 10By Seed SourceConventional Seed · Organic Certified Seed · Non-GMO Verified Seed
- 11By Grower ScaleLarge Commercial Growers · Small and Medium Growers · Home and Hobby Growers
- 12By Region
Market Analysis & Outlook
Microgreens are the young seedlings of vegetables, herbs and edible plants, harvested shortly after the first true leaves appear and sold for their colour, flavour and concentrated nutrients. They reach buyers as live trays, cut and packaged greens or processed forms, and are grown indoors, in greenhouses, in modular containers or outdoors. Buyers include restaurants and hotels, retailers, food processors, institutional caterers and households.
Growth of 11.5% a year carries the global microgreens market from USD 3 billion in 2025 to USD 7.98 billion in 2034. The full series behind that rate covers USD 1.55 billion in 2020, USD 2.63 billion in 2024, USD 3.34 billion in 2026 and USD 5.16 billion in 2030, with 2025 as the base year.
18% of 2025 revenue sits in Broccoli, worth USD 0.54 billion and rising to USD 1.237 billion at 15.5% by 2034, the largest type line in both years. Growth is fastest in Sunflower at 13.42% and slowest in Broccoli at 9.65%. Share moves toward Pea Shoots, Sunflower and Other Varieties and away from Broccoli, Arugula, Radish, Basil and Cabbage and Kale, though no line shrinks in revenue terms.
The farming method split puts Indoor Vertical Farming first, at USD 1.23 billion and 41% of revenue in 2025, rising to USD 3.58 billion and 44.87% in 2034. It is also the fastest-growing line on this axis at 12.6%, so the split concentrates over the period instead of balancing. It cuts the same total as the type axis from a different commercial angle, so revenue does not add across the two.
USD 0.99 billion of 2025 revenue is generated in North America, 33% of the global total and the largest regional share; it reaches USD 2.314 billion by 2034. Asia Pacific is next at 28% and USD 0.84 billion, and Latin America last at 5%. Because Asia Pacific and Latin America take share, the revenue added by 2034 concentrates instead of spreading across all five regions.
Coverage extends to five regions, eight type lines and eleven segmentation axes over the full fifteen years. The 2025 total itself is triangulated from published sources and category proxies, with no independently sourced count behind it, and the splits below are estimated on that same basis, a bound on their precision worth carrying into any use of them.
Market Size, 2020–2034
USD BillionRevenue in USD Billion. Values up to 2025 are actuals; 2026–2034 are forecast.
Key Takeaways
- A forecast-period rate of 11.5% takes the market from USD 3 billion in 2025 to USD 7.98 billion in 2034, against 14.12% recorded over the 2020-2025 historical period.
- The largest line by type is Broccoli, worth USD 0.54 billion and 18% of revenue in 2025, rising to USD 1.237 billion and 15.5% by 2034.
- At 13.42%, Sunflower grows faster than any other type line, moving from USD 0.45 billion and 15% of revenue in 2025 to USD 1.397 billion and 17.5% in 2034.
- Against a base case of USD 7.98 billion in 2034, the study also reports a bear case at USD 6.55 billion and a bull case at USD 9.05 billion, with the assumptions behind each set out separately.
- 33% of 2025 revenue is generated in North America, worth USD 0.99 billion and rising to USD 2.314 billion by 2034; Latin America is smallest at 5%.
- The United States accounts for 80.81% of North America in the base year, worth USD 0.8 billion in 2025 and reaching USD 1.85 billion by 2034, the worked country example carried through that region's chapters.
- Fifteen years are reported, 2020 to 2034 with 2025 as the base: revenue, share and growth rate per line, per axis and per region, not as a single blended series.
Market Trends
Revenue Share, By type
Base year 2025Broccoli leads with 18.0% of type segment revenue.
Share of type segment revenue, most recent base year. The 2 smallest segments are grouped as Other.
Three things move over 2026-2034, and they are worth separating: the type mix, the regional balance, and the 11.5% compounding underneath both.
The direction of the market is not in question in any of the three. Each line and each region grows in revenue terms; what separates them is which takes the larger part of the growth.
The type mix tilts toward Sunflower. Between 2026 and 2034, 13.42% growth in Sunflower against 9.65% in Broccoli pulls the type mix apart. By 2034 the two sit at 17.5% and 15.5% of revenue, against 15% and 18% in 2025. In absolute terms Sunflower rises from USD 0.45 billion to USD 1.397 billion, while Broccoli rises from USD 0.54 billion to USD 1.237 billion. Both grow; the gap is wide enough to reshape the mix inside a single forecast window.
Regional weight shifts toward Asia Pacific and Latin America. Asia Pacific moves from 28% of revenue in 2025 to 35% in 2034, worth USD 0.84 billion rising to USD 2.793 billion; Latin America moves from 5% of revenue in 2025 to 5.5% in 2034, worth USD 0.15 billion rising to USD 0.439 billion. The offsetting side is North America at 33% moving to 29%, Europe at 27% moving to 24%, Middle East and Africa at 7% moving to 6.5%, none of which contracts. Revenue added in this market is therefore concentrating geographically instead of spreading evenly, and a participant weighted toward a share-losing region grows more slowly than the market even while its own revenue climbs.
Fifteen years without a discontinuity. The market moves through USD 1.55 billion in 2020, USD 2.63 billion in 2024, USD 3 billion in 2025, USD 3.34 billion in 2026, USD 5.16 billion in 2030 and USD 7.98 billion in 2034. Against 14.12% through the historical period, the 11.5% forecast rate is a continuation; no year in the series interrupts it. For a participant that makes planning a question of capturing a share of steady expansion instead of timing a discontinuity, and it is why the type and regional mixes matter more to a forecast than the headline rate does.
Market Growth Factors
Sunflower adds the most incremental growth
Market Drivers
3- 01Sunflower adds the most incremental growth
The fastest line on the type axis is Sunflower, at 13.42% against the market's 11.5%, taking USD 0.45 billion to USD 1.397 billion and 15% of revenue to 17.5%. The market's overall 11.5% depends on that rate holding: at the 9.65% recorded by Broccoli, the same revenue base would compound to a materially smaller 2034 total. Where a supplier sits on this axis therefore decides whether it grows with the market or below it.
- 02The two largest regions hold most of the base
33% of 2025 revenue (USD 0.99 billion) is generated in North America, reaching USD 2.314 billion by 2034 at an unchanged 29%. Asia Pacific is next at 28% of revenue, USD 0.84 billion in 2025 and USD 2.793 billion in 2034. Most of the base and most of the growth sit in those two, and a plan spread evenly across regions therefore over-invests outside them.
- 03The trend is already in the record
USD 1.55 billion in 2020, USD 2.63 billion in 2024 and USD 3 billion in 2025: 14.12% compound growth before the forecast period even begins. From there the forecast carries 11.5% through to USD 7.98 billion in 2034. A forecast extending an observed trend is a different proposition from one proposing a turn, and that is why no ramp is applied: the 11.5% runs evenly across the period.
Growth drivers
| # | Growth driver | Impact | Gross contribution (USD Billion) | 2026-28 | 2029-31 | 2032-34 |
|---|---|---|---|---|---|---|
| 1 | Rising use in restaurant and hotel menus | High | +1.55 | High | High | Medium |
| 2 | Indoor vertical farming scale-up and falling unit costs | High | +1.3 | High | High | Medium |
| 3 | Health and nutrient-density awareness among consumers | Medium-High | +1 | Medium | High | Medium |
| 4 | Wider retail and online grocery distribution of fresh produce | Medium | +0.7 | High | Medium | Medium |
| 5 | Shift toward organic and clean-label food | Medium | +0.45 | Medium | Medium | Medium |
| 6 | Others | Low | +0.4 | Low | Low | Low |
| Total | +5.4 | |||||
Restraints
| # | Restraint | Impact | Estimated reduction (USD Billion) | 2026-28 | 2029-31 | 2032-34 |
|---|---|---|---|---|---|---|
| 1 | Short shelf life and cold-chain losses | Medium-High | −0.2 | High | Medium | Medium |
| 2 | High energy and labour costs in indoor production | Medium | −0.14 | High | Medium | Low |
| 3 | Food-safety and seed-sanitation concerns | Low | −0.08 | Medium | Medium | Low |
| Total | −0.42 | |||||
Drivers contribute 5.4 USD Billion and restraints remove 0.42 USD Billion, a net 4.98 USD Billion, which is the revenue the market adds between the base year and 2034. Contributions are CDI estimates, apportioned so that they reconcile with the forecast rather than being read from it.
Growth in the global microgreens market comes from three measurable sources over 2026-2034: the market's own compounding at 11.5%, the share gained by faster-growing type lines, and expansion in the regions taking a larger part of global revenue.
Restraining Factors
Broccoli grows below the market rate
Market Restraints
2- 01Broccoli grows below the market rate
With 18% of 2025 revenue (USD 0.54 billion) Broccoli is where most of the market sits, and it grows at only 9.65% against the market's 11.5%. Revenue still reaches USD 1.237 billion by 2034 and share still falls to 15.5%: a drag on the average, not a decline.
- 02The smallest region stays small
Latin America accounts for 5% of 2025 revenue at USD 0.15 billion, reaching USD 0.439 billion and 5.5% by 2034, the smallest of the five regions in both years. Its absolute contribution to the revenue added by 2034 stays limited whatever its own growth rate does.
Market Opportunities
Upside case: USD 9.05 billion by 2034
Market Opportunities
2- 01Upside case: USD 9.05 billion by 2034
What would beat the forecast: indoor farm costs fall faster than planned, retailers list live and cut trays in more stores, and restaurant and household demand grows at a pace close to the highest published forecasts. That case reaches USD 9.05 billion in 2034 against USD 7.98 billion, and it is worth testing against a reader's own read of the market.
- 02Sunflower share moves from 15% to 17.5%
Sunflower grows at 13.42% against 11.5% for the market, adding revenue from USD 0.45 billion in 2025 to USD 1.397 billion in 2034 and taking its share from 15% to 17.5%. It is the place on this axis where share changes hands at scale, so it is where an entrant can take position without displacing the incumbent in Broccoli.
Market Challenges
Revenue is concentrated in Broccoli
Market Challenges
2- 01Revenue is concentrated in Broccoli
Broccoli is 18% of 2025 revenue at USD 0.54 billion and still 15.5% at USD 1.237 billion in 2034. That concentration means the market's own forecast is, to a large extent, a forecast for one type line.
- 02Single-country exposure in North America
North America is worth USD 0.99 billion in 2025 and USD 0.8 billion of that is the United States; 80.81% of the region, reaching USD 1.85 billion in 2034. The consequence is that regional risk here is really country risk wearing a larger label.
Segmentation Analysis
11 axesThe global microgreens market is cut eleven ways: by type, farming method, growing medium, form, distribution channel, end user, application, nature, packaging format, seed source and grower scale. They are alternative readings of one revenue pool, not parts that sum to it.
There are eight lines on the type axis, and all of them grow in revenue between 2025 and 2034. What separates them is share: three gain it, the rest give it up.
By Type · 8 segments
By Type
- Largest Broccoli · 18%
- Fastest Sunflower · 13.4%
- Moves most Broccoli · -2.5 pts
- Order by 2034 changes
| Segment | 2025 | Share | 2034 | Share | CAGR |
|---|---|---|---|---|---|
| Broccoli | $0.54B | 18% | $1.24B | 15.5%-2.5 | 9.7% |
| Arugula | $0.27B | 9% | $0.68B | 8.5%-0.5 | 10.8% |
| Radish | $0.42B | 14% | $1B | 12.5%-1.5 | 10.1% |
| Pea Shoots | $0.51B | 17% | $1.48B | 18.5%+1.5 | 12.6% |
| Basil | $0.36B | 12% | $0.96B | 12% | 11.5% |
| Sunflower | $0.45B | 15% | $1.40B | 17.5%+2.5 | 13.4% |
| Cabbage and Kale | $0.24B | 8% | $0.64B | 8% | 11.5% |
| Other Varieties | $0.21B | 7% | $0.60B | 7.5%+0.5 | 12.3% |
2025 to 2034 revenue and share by line: Broccoli USD 0.54 billion to USD 1.237 billion (18% to 15.5%), Pea Shoots USD 0.51 billion to USD 1.476 billion (17% to 18.5%), Sunflower USD 0.45 billion to USD 1.397 billion (15% to 17.5%), Radish USD 0.42 billion to USD 0.998 billion (14% to 12.5%), Basil USD 0.36 billion to USD 0.958 billion (12% to 12%), Arugula USD 0.27 billion to USD 0.678 billion (9% to 8.5%), Cabbage and Kale USD 0.24 billion to USD 0.637 billion (8% to 8%), Other Varieties USD 0.21 billion to USD 0.599 billion (7% to 7.5%). Sunflower Outpaces the Axis While Broccoli Holds the Largest Share Broccoli holds the lead through the early years on its established nutrition reputation and wide foodservice use, while pea shoots take over later as retail trays favour mild, larger-leaf products. Sunflower grows fastest because it is easy to grow reliably in indoor systems, has a consistent texture and suits salads and sandwiches. By 2034 the largest line is Pea Shoots and no longer Broccoli, the one axis here where the order actually changes. This is the axis the estimation prices in full, year by year, and the one the regional chapters cut against.
By Farming Method · 4 segments
Indoor Vertical Farming Both Leads the Farming method Axis and Grows Fastest on It
- Largest Indoor Vertical Farming · 41%
- Fastest Indoor Vertical Farming · 12.6%
- Moves most Indoor Vertical Farming · +3.9 pts
- Order by 2034 changes
| Segment | 2025 | Share | 2034 | Share | CAGR |
|---|---|---|---|---|---|
| Indoor Vertical Farming | $1.23B | 41% | $3.58B | 44.9%+3.9 | 12.6% |
| Greenhouse | $1.05B | 35% | $2.69B | 33.7%-1.3 | 11% |
| Outdoor/Open Field | $0.39B | 13% | $0.78B | 9.8%-3.2 | 8% |
| Container/Modular Farms | $0.33B | 11% | $0.93B | 11.7%+0.7 | 12.2% |
Indoor vertical farming leads and grows fastest because it gives year-round supply, controlled quality and short delivery distances to city buyers, which matter for a crop that spoils within days. Falling lighting and automation costs keep widening the gap with greenhouses, while open-field production is limited by season and weather exposure. Indoor Vertical Farming remains the largest line through 2034, so the axis changes in proportion, not in order.
By Growing Medium · 5 segments
Hydroponic Mats Held the Dominant Share of the Growing medium Segment in 2025
- Largest Hydroponic Mats · 28%
- Fastest Water-Only/Seed Tray · 14.1%
- Moves most Hydroponic Mats · +4.6 pts
- Order by 2034 unchanged
| Segment | 2025 | Share | 2034 | Share | CAGR |
|---|---|---|---|---|---|
| Soil | $0.72B | 24% | $1.60B | 20.1%-3.9 | 9.3% |
| Peat Moss | $0.69B | 23% | $1.52B | 19.1%-3.9 | 9.2% |
| Coco Coir | $0.45B | 15% | $1.28B | 16%+1 | 12.3% |
| Hydroponic Mats | $0.84B | 28% | $2.60B | 32.6%+4.6 | 13.4% |
| Water-Only/Seed Tray | $0.30B | 10% | $0.98B | 12.3%+2.3 | 14.1% |
Hydroponic mats lead because they give clean, uniform trays that handle easily, suit automated harvest and reduce soil-borne contamination risk. Water-only and seed-tray systems grow fastest from a small base as indoor growers cut input cost and cleaning time, and as buyers look for very clean product. Soil and peat remain common among smaller and outdoor growers. The order does not change: Hydroponic Mats is still largest in 2034, and what moves is how much it holds.
By Form · 3 segments
Fresh/Live Tray Led by Form in 2025, with Cut and Packaged Growing Fastest
- Largest Fresh/Live Tray · 60%
- Fastest Cut and Packaged · 13.6%
- Moves most Cut and Packaged · +6.2 pts
- Order by 2034 unchanged
| Segment | 2025 | Share | 2034 | Share | CAGR |
|---|---|---|---|---|---|
| Fresh/Live Tray | $1.80B | 60% | $4.38B | 54.9%-5.1 | 10.4% |
| Cut and Packaged | $1.02B | 34% | $3.21B | 40.2%+6.2 | 13.6% |
| Processed (Frozen/Dried/Powder) | $0.18B | 6% | $0.39B | 4.9%-1.1 | 9% |
Fresh and live trays lead because buyers value visible freshness, longer usable life when cut to order and the chef-facing presentation. Cut and packaged product grows fastest as supermarkets and food processors want ready-to-use formats with defined shelf life and easier handling. Processed forms stay small because the fresh quality that sets the product apart is largely lost. The order does not change: Fresh/Live Tray is still largest in 2034, and what moves is how much it holds.
By Distribution Channel · 5 segments
Supermarkets and Hypermarkets Led by Distribution channel in 2025, with Online Retail Growing Fastest
- Largest Supermarkets and Hypermarkets · 28%
- Fastest Online Retail · 17.6%
- Moves most Online Retail · +7.4 pts
- Order by 2034 changes
| Segment | 2025 | Share | 2034 | Share | CAGR |
|---|---|---|---|---|---|
| Supermarkets and Hypermarkets | $0.84B | 28% | $2B | 25.1%-2.9 | 10.1% |
| Specialty and Natural Food Stores | $0.57B | 19% | $1.35B | 16.9%-2.1 | 10.1% |
| Online Retail | $0.36B | 12% | $1.55B | 19.4%+7.4 | 17.6% |
| Farmers Markets and Direct Sales | $0.45B | 15% | $0.68B | 8.5%-6.5 | 4.7% |
| Foodservice Distributors | $0.78B | 26% | $2.40B | 30.1%+4.1 | 13.3% |
Supermarkets lead early because they reach the most households with packaged trays, and foodservice distributors take the top place later as restaurants and hotels widen their menus. Online retail grows fastest because subscription boxes and quick-delivery grocery suit a perishable product that buyers want delivered fresh in small, frequent orders. Farmers markets stay local and grow slowest. Leadership changes hands: Foodservice Distributors is the largest line by 2034, not Supermarkets and Hypermarkets.
By End User · 4 segments
Restaurants and Hotels Led by End user in 2025, with Household/Retail Consumers Growing Fastest
- Largest Restaurants and Hotels · 38%
- Fastest Household/Retail Consumers · 13%
- Moves most Restaurants and Hotels · -3.5 pts
- Order by 2034 changes
| Segment | 2025 | Share | 2034 | Share | CAGR |
|---|---|---|---|---|---|
| Household/Retail Consumers | $0.69B | 23% | $2.07B | 25.9%+2.9 | 13% |
| Restaurants and Hotels | $1.14B | 38% | $2.75B | 34.5%-3.5 | 10.3% |
| Catering and Institutional | $0.45B | 15% | $1.20B | 15% | 11.5% |
| Food Processors | $0.72B | 24% | $1.96B | 24.6%+0.6 | 11.8% |
Restaurants and hotels lead because chefs use microgreens for plating, flavour and menu differentiation in volumes that repeat weekly. Households grow fastest as retail trays, home delivery and cooking content bring the product into everyday meals. Food processors expand with ready meals and snack launches, while catering and institutional buyers adopt more slowly because of price sensitivity. The order does not change: Restaurants and Hotels is still largest in 2034, and what moves is how much it holds.
By Application · 5 segments
Nutraceutical Ingredients Outpaces the Axis While Garnishing and Plating Holds the Largest Share
- Largest Garnishing and Plating · 35%
- Fastest Nutraceutical Ingredients · 16.1%
- Moves most Garnishing and Plating · -4.9 pts
- Order by 2034 changes
| Segment | 2025 | Share | 2034 | Share | CAGR |
|---|---|---|---|---|---|
| Garnishing and Plating | $1.05B | 35% | $2.40B | 30.1%-4.9 | 9.6% |
| Salads and Sandwiches | $0.84B | 28% | $2.20B | 27.6%-0.4 | 11.3% |
| Smoothies and Juices | $0.39B | 13% | $1.20B | 15%+2 | 13.3% |
| Soups and Cooked Dishes | $0.42B | 14% | $1.03B | 12.9%-1.1 | 10.5% |
| Nutraceutical Ingredients | $0.30B | 10% | $1.15B | 14.4%+4.4 | 16.1% |
Garnishing and plating leads because it is the long-established use, backed by chef demand for colour, texture and concentrated flavour. Nutraceutical ingredients grow fastest from a small base as concentrates and powders from sprouted greens find use in supplements and functional foods. Salads and sandwiches rise steadily with retail availability, and smoothies gain with the wellness trend. Garnishing and Plating remains the largest line through 2034, so the axis changes in proportion, not in order.
By Nature · 2 segments
Conventional Led by Nature in 2025, with Organic Growing Fastest
- Largest Conventional · 78%
- Fastest Organic · 15.9%
- Moves most Conventional · -9.2 pts
- Order by 2034 unchanged
| Segment | 2025 | Share | 2034 | Share | CAGR |
|---|---|---|---|---|---|
| Conventional | $2.34B | 78% | $5.49B | 68.8%-9.2 | 9.9% |
| Organic | $0.66B | 22% | $2.49B | 31.2%+9.2 | 15.9% |
Conventional product leads because it is priced for mainstream retail and foodservice buyers and is available from nearly every grower. Organic grows fastest as health-focused households and premium restaurants pay more for certified product, and as retailers extend organic ranges into fresh herbs and specialty greens. By 2034 Conventional is still ahead, making this a shift in weight, not a change of leader.
By Packaging Format · 5 segments
Plastic Clamshells Held the Dominant Share of the Packaging format Segment in 2025
- Largest Plastic Clamshells · 40%
- Fastest Compostable Containers · 17.9%
- Moves most Plastic Clamshells · -7.4 pts
- Order by 2034 changes
| Segment | 2025 | Share | 2034 | Share | CAGR |
|---|---|---|---|---|---|
| Plastic Clamshells | $1.20B | 40% | $2.60B | 32.6%-7.4 | 9% |
| Compostable Containers | $0.33B | 11% | $1.45B | 18.2%+7.2 | 17.9% |
| Pouches and Bags | $0.36B | 12% | $1B | 12.5%+0.5 | 12% |
| Live Trays | $0.75B | 25% | $2.10B | 26.3%+1.3 | 12.1% |
| Bulk Packs | $0.36B | 12% | $0.83B | 10.4%-1.6 | 9.7% |
Plastic clamshells lead because they protect delicate leaves, stack well in distribution and are the format retailers already handle. Compostable containers grow fastest as retailers and regulators press for lower plastic use and as growers find that the material now protects product adequately. Live trays serve chefs who cut to order, and bulk packs serve processors. The order does not change: Plastic Clamshells is still largest in 2034, and what moves is how much it holds.
By Seed Source · 3 segments
Conventional Seed Led by Seed source in 2025, with Non-GMO Verified Seed Growing Fastest
- Largest Conventional Seed · 63%
- Fastest Non-GMO Verified Seed · 14.1%
- Moves most Conventional Seed · -7.9 pts
- Order by 2034 unchanged
| Segment | 2025 | Share | 2034 | Share | CAGR |
|---|---|---|---|---|---|
| Conventional Seed | $1.89B | 63% | $4.40B | 55.1%-7.9 | 9.8% |
| Organic Certified Seed | $0.69B | 23% | $2.20B | 27.6%+4.6 | 13.8% |
| Non-GMO Verified Seed | $0.42B | 14% | $1.38B | 17.3%+3.3 | 14.1% |
Conventional seed leads because it is cheapest, widely stocked and suited to the varieties most often grown. Non-GMO verified seed grows fastest as retailers and brand owners ask growers for documented seed provenance, and organic certified seed follows the expansion of organic production and its stricter sourcing rules. Conventional Seed remains the largest line through 2034, so the axis changes in proportion, not in order.
By Grower Scale · 3 segments
Scale and Growth Sit in the Same Line on the Grower scale Axis: Large Commercial Growers
- Largest Large Commercial Growers · 60%
- Fastest Large Commercial Growers · 12.3%
- Moves most Large Commercial Growers · +3.9 pts
- Order by 2034 unchanged
| Segment | 2025 | Share | 2034 | Share | CAGR |
|---|---|---|---|---|---|
| Large Commercial Growers | $1.80B | 60% | $5.10B | 63.9%+3.9 | 12.3% |
| Small and Medium Growers | $1.02B | 34% | $2.55B | 31.9%-2.1 | 10.7% |
| Home and Hobby Growers | $0.18B | 6% | $0.33B | 4.1%-1.9 | 7% |
Large commercial growers lead and grow fastest because scale cuts the cost per tray, supports contracts with retailers and distributors, and funds the automation and food-safety systems that large buyers require. Small and medium growers keep a large share by supplying local restaurants and markets, and home growers stay small because they sell little outside their own kitchens. The order does not change: Large Commercial Growers is still largest in 2034, and what moves is how much it holds.
Regional Insights
Regional Revenue Share
Base year 2025Share of global revenue in the base year.
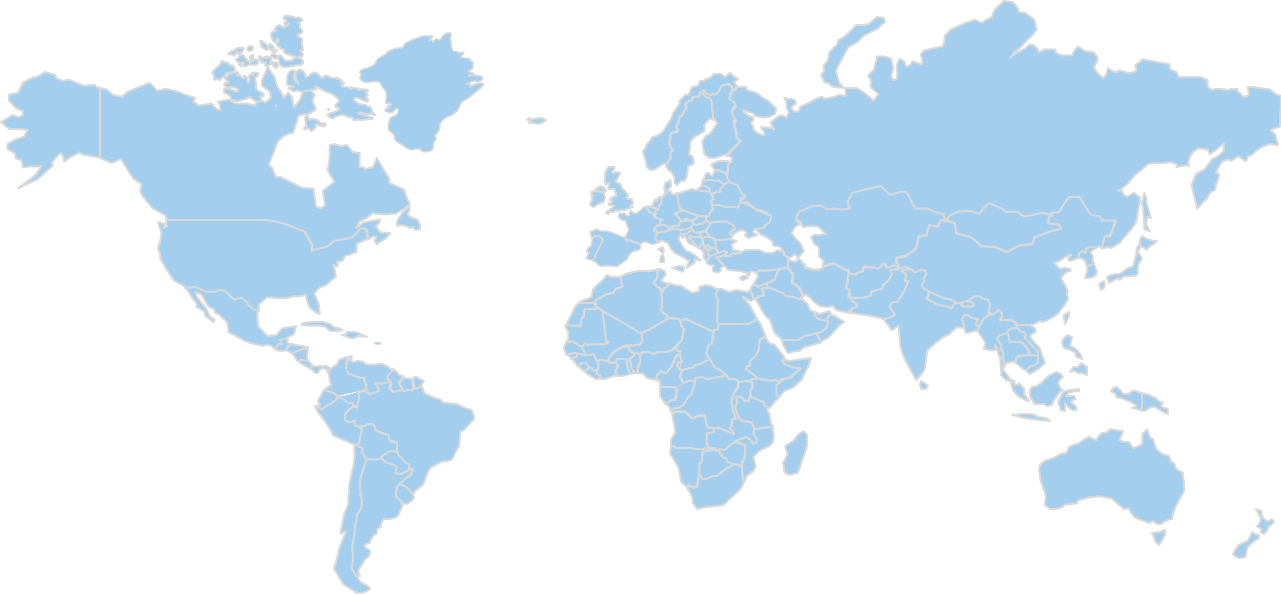
Only the leading region's share is published outside the report; pins mark the region, not a specific country.
North America Market Analysis
The largest region covered — 4 points of share move elsewhere by 2034, while revenue still grows 2.3×.
- Rank 1 of 5
- 2025 share 33%
- By 2034 29%
- Revenue $0.99B → $2.31B
33% of the global microgreens market sits in North America in 2025, worth USD 0.99 billion and reaches USD 2.314 billion by 2034. That makes it the first-largest region covered, in 2025 and again in 2034.
Share settles at 29% in 2034, though revenue still rises throughout; the shift is in the region's weight against faster-growing ones, which is not the same as weakening demand.
Within the region the type split tracks the global one; 18% of 2025 revenue in Broccoli, fastest growth of 13.42% in Sunflower. Revenue for North America is broken out by every segmentation axis and by country in the full report.
United States
Sets the pace for North America at 80.8% of it, growing 2.3×.
- In region 1 of 2
- Of region 80.8%
- Of global 26.7%
- Revenue $0.80B → $1.85B
The United States is the largest market within North America, generating USD 0.8 billion in 2025 and projected to reach USD 1.85 billion by 2034. At 80.81% of regional revenue in the base year it is not one market among several, the region's trajectory is largely this country's trajectory. Regional revenue of USD 0.99 billion in 2025 and USD 2.314 billion in 2034 sits around it, and it is the country used wherever the full report cuts a figure by geography.
Composition here matches the global split: the largest line is Broccoli at 18% of 2025 revenue, easing to 15.5% by 2034, and the fastest is Sunflower at 13.42%, from 15% to 17.5%. Its 80.81% weight in North America means those movements carry straight into the regional totals. The United States carries its own type breakdown in the full report.
Microgreens are fresh produce, so the Food and Drug Administration oversees them under the Federal Food, Drug, and Cosmetic Act and the Food Safety Modernization Act. Growers fall under the Produce Safety Rule, which sets standards for agricultural water, worker hygiene, sprouting-adjacent practices and records; very small farms may qualify for partial exemptions. Seed and growing media must come from sources that support pathogen control. Packaged product carries labelling covering identity, net quantity and the name and address of the producer, with allergen and nutrition rules applying where relevant. No premarket approval is needed. The Department of Agriculture handles organic certification for those who claim it, and state agencies add licensing and inspection.
Competition in the United States runs between the suppliers this study tracks: Gotham Greens Holdings, PBC, AeroFarms, Fresh Origins, LLC, Ball Horticultural Company, Sakata Seed Corporation, Bowery Farming Inc., Edenworks, Madar Farms, Living Earth Farm, Chef's Garden, Inc., Shoots & Roots, Urban Cultivator, Farmbox Greens, Rocket Gardens, Square Roots, Eat Your Microgreens, Italian Sprout, Beekenkamp Group, Kaizen Microgreens, Bright Farms, Inc., Pete's Living Greens and Garden Fresh Microgreens. Two different problems sit on the same axis: holding Broccoli at 18% of 2025 revenue, and taking Sunflower while it grows at 13.42%. Country-level positioning and shares for each of these companies are part of the full report, not of this summary.
Canada
2nd-largest in North America, growing 2.4×.
- In region 2 of 2
- Of region 9.1%
- Of global 3%
- Revenue $0.09B → $0.22B
Canada is sized at USD 0.09 billion in 2025, rising to USD 0.22 billion by 2034; 3% of global revenue and 9.09% of North America. It is reported separately from the United States across every segmentation axis in the full report.
Europe Market Analysis
The 3rd-largest region covered — 3 points of share move elsewhere by 2034, while revenue still grows 2.4×.
- Rank 3 of 5
- 2025 share 27%
- By 2034 24%
- Revenue $0.81B → $1.92B
27% of the global microgreens market sits in Europe in 2025, worth USD 0.81 billion and reaches USD 1.915 billion by 2034. That makes it the third-largest region covered, in 2025 and again in 2034.
Share settles at 24% in 2034, though revenue still rises throughout; the shift is in the region's weight against faster-growing ones, which is not the same as weakening demand.
Segment composition follows the global pattern: Broccoli largest at 18% of 2025 revenue, Sunflower fastest at 13.42%. Revenue for Europe is broken out by every segmentation axis and by country in the full report.
Germany
The largest market in Europe, growing 2.2×.
- In region 1 of 3
- Of region 21%
- Of global 5.7%
- Revenue $0.17B → $0.38B
20.99% of Europe's base-year revenue comes from Germany; USD 0.17 billion, rising to USD 0.38 billion by 2034. It accounts for 20.99% of regional revenue in the base year, the largest single share without dominating the region outright. The region itself runs USD 0.81 billion to USD 1.915 billion over the same period, and this is the market carrying the country-level detail in the full report.
The type pattern in Germany is the global one: 18% of 2025 revenue in Broccoli, 15.5% by 2034, against 13.42% growth in Sunflower taking it from 15% to 17.5%. Because the country carries 20.99% of Europe, a movement in its own mix shows up in the regional totals instead of being averaged away by neighbouring markets. The full report reports Germany by type separately.
Microgreens are treated as fresh vegetables and food of plant origin, governed by the General Food Law of the European Union and the EU food hygiene package. Producers register as food business operators with the competent authority of their Land, and local food control offices inspect premises. Operators must run hazard analysis procedures and keep traceability records, with particular attention to seed hygiene because of past sprout-related outbreaks. Pesticide residue limits and contaminant limits apply. Prepacked product follows the EU Food Information Regulation on labelling, and organic claims require certification under the EU organic framework. No product-specific approval is needed.
Competition in Germany runs between the suppliers this study tracks: Gotham Greens Holdings, PBC, AeroFarms, Fresh Origins, LLC, Ball Horticultural Company, Sakata Seed Corporation, Bowery Farming Inc., Edenworks, Madar Farms, Living Earth Farm, Chef's Garden, Inc., Shoots & Roots, Urban Cultivator, Farmbox Greens, Rocket Gardens, Square Roots, Eat Your Microgreens, Italian Sprout, Beekenkamp Group, Kaizen Microgreens, Bright Farms, Inc., Pete's Living Greens and Garden Fresh Microgreens. Two different problems sit on the same axis: holding Broccoli at 18% of 2025 revenue, and taking Sunflower while it grows at 13.42%. A supplier weighted toward Europe is competing over a base of USD 0.81 billion in 2025, reaching USD 1.915 billion by 2034 on the trajectory this study models.
United Kingdom
2nd-largest in Europe, growing 2.3×.
- In region 2 of 3
- Of region 18.5%
- Of global 5%
- Revenue $0.15B → $0.34B
5% of global revenue is generated in the United Kingdom; USD 0.15 billion in 2025, reaching USD 0.34 billion in 2034, and 18.52% of Europe.
France
3rd-largest in Europe, growing 2.3×.
- In region 3 of 3
- Of region 16.1%
- Of global 4.3%
- Revenue $0.13B → $0.30B
France is sized at USD 0.13 billion in 2025, rising to USD 0.3 billion by 2034; 4.33% of global revenue and 16.05% of Europe. It is reported separately from Germany across every segmentation axis in the full report.
Asia Pacific Market Analysis
The 2nd-largest region covered, and the one gaining the most — it picks up 7 points of share by 2034, while revenue still grows 3.3×.
- Rank 2 of 5
- 2025 share 28%
- By 2034 35%
- Revenue $0.84B → $2.79B
Asia Pacific holds 28% of the global microgreens market in 2025, worth USD 0.84 billion and reaches USD 2.793 billion by 2034. That makes it the second-largest region covered, in 2025 and again in 2034.
Share climbs to 35% by 2034, because it outgrows the market's 11.5%; the revenue added here is disproportionate to where the region started.
The type mix reported at global level applies here, with Broccoli the largest line at 18% of 2025 revenue and Sunflower the fastest-growing at 13.42%. Asia Pacific is reported axis by axis and country by country in the full study.
China
The largest market in Asia Pacific, growing 4.0×.
- In region 1 of 3
- Of region 23.8%
- Of global 6.7%
- Revenue $0.20B → $0.80B
The largest single market in Asia Pacific is China, at USD 0.2 billion in 2025 and USD 0.8 billion in 2034. At 23.81% of the region in 2025 it leads, but a majority of Asia Pacific's revenue is generated in other markets. The region itself runs USD 0.84 billion to USD 2.793 billion over the same period, and this is the market carrying the country-level detail in the full report.
Demand in China follows the type mix reported at global level: Broccoli is the largest line at 18% of 2025 revenue, moving to 15.5% by 2034, while Sunflower grows fastest at 13.42% and takes its share from 15% to 17.5%. Its 23.81% weight in Asia Pacific means those movements carry straight into the regional totals. The full report reports China by type separately.
Microgreens fall under the Food Safety Law, administered by the State Administration for Market Regulation, with agricultural production overseen by the Ministry of Agriculture and Rural Affairs. Growers are expected to meet the national food safety standards for pesticide residues and contaminants, and edible agricultural products must be traceable and pass quality checks before sale. Business operators need a food operation licence for trading, and facilities are subject to local market supervision inspections. Prepackaged product follows the national general rule for labelling of prepackaged foods. Green food and organic labels exist as voluntary certifications. Imported seed is subject to plant quarantine controls.
In China the field is Gotham Greens Holdings, PBC, AeroFarms, Fresh Origins, LLC, Ball Horticultural Company, Sakata Seed Corporation, Bowery Farming Inc., Edenworks, Madar Farms, Living Earth Farm, Chef's Garden, Inc., Shoots & Roots, Urban Cultivator, Farmbox Greens, Rocket Gardens, Square Roots, Eat Your Microgreens, Italian Sprout, Beekenkamp Group, Kaizen Microgreens, Bright Farms, Inc., Pete's Living Greens and Garden Fresh Microgreens. The commercially relevant division is 18% of 2025 revenue in Broccoli, where the volume is, against 13.42% growth in Sunflower, where share moves. The commercial size of that position is USD 0.84 billion in 2025, moving to USD 2.793 billion by 2034 across the forecast period.
Japan
2nd-largest in Asia Pacific, growing 2.8×.
- In region 2 of 3
- Of region 16.7%
- Of global 4.7%
- Revenue $0.14B → $0.39B
Japan is sized at USD 0.14 billion in 2025, rising to USD 0.39 billion by 2034; 4.67% of global revenue and 16.67% of Asia Pacific. It is reported separately from China across every segmentation axis in the full report.
India
3rd-largest in Asia Pacific, growing 4.3×.
- In region 3 of 3
- Of region 7.1%
- Of global 2%
- Revenue $0.06B → $0.26B
2% of global revenue is generated in India; USD 0.06 billion in 2025, reaching USD 0.26 billion in 2034, and 7.14% of Asia Pacific.
Latin America Market Analysis
The 5th-largest region covered — it picks up 0.5 points of share by 2034, while revenue still grows 2.9×.
- Rank 5 of 5
- 2025 share 5%
- By 2034 5.5%
- Revenue $0.15B → $0.44B
5% of the global microgreens market sits in Latin America in 2025, worth USD 0.15 billion rising to USD 0.439 billion in 2034. Among the five regions it ranks fifth by revenue in both years.
5.5% of global revenue sits here by 2034, up from the 2025 level, at a pace above the 11.5% global rate, so this region warrants separate treatment and should not be scaled off the total.
Within the region the type split tracks the global one; 18% of 2025 revenue in Broccoli, fastest growth of 13.42% in Sunflower. Latin America is reported axis by axis and country by country in the full study.
Brazil
The largest market in Latin America, growing 3.0×.
- In region 1 of 2
- Of region 33.3%
- Of global 1.7%
- Revenue $0.05B → $0.15B
USD 0.05 billion of Latin America's 2025 revenue is generated in Brazil, the region's largest market, reaching USD 0.15 billion by 2034. 33.33% of the region in the base year makes it the largest market here without making it the region. Set against USD 0.15 billion and USD 0.439 billion for the region, it is why this market, and not a smaller one, is the one reported in full.
Brazil buys along the same lines as the market globally; Broccoli first at 18% of 2025 revenue and 15.5% in 2034, Sunflower fastest at 13.42% on a share moving from 15% to 17.5%. Its 33.33% weight in Latin America means those movements carry straight into the regional totals. Per-type revenue for Brazil appears on its own in the full report.
Fresh microgreens sit between two authorities: the Ministry of Agriculture, Livestock and Supply regulates primary production, plant health and organic certification, while the national health surveillance agency, Anvisa, sets sanitary rules for food and residue limits. Producers must follow good agricultural and hygiene practices, and processing sites need a sanitary licence from state or municipal health surveillance. Pesticide use is limited to products registered for the crop. Prepackaged items must follow Anvisa labelling rules covering identity, ingredients, origin and producer details. Organic claims require registration in the national organic producers' system. Imported seeds need phytosanitary documentation.
In Brazil the field is Gotham Greens Holdings, PBC, AeroFarms, Fresh Origins, LLC, Ball Horticultural Company, Sakata Seed Corporation, Bowery Farming Inc., Edenworks, Madar Farms, Living Earth Farm, Chef's Garden, Inc., Shoots & Roots, Urban Cultivator, Farmbox Greens, Rocket Gardens, Square Roots, Eat Your Microgreens, Italian Sprout, Beekenkamp Group, Kaizen Microgreens, Bright Farms, Inc., Pete's Living Greens and Garden Fresh Microgreens. Two different problems sit on the same axis: holding Broccoli at 18% of 2025 revenue, and taking Sunflower while it grows at 13.42%. A supplier weighted toward Latin America is competing over a base of USD 0.15 billion in 2025, reaching USD 0.439 billion by 2034 on the trajectory this study models.
Mexico
2nd-largest in Latin America, growing 3.1×.
- In region 2 of 2
- Of region 23.3%
- Of global 1.2%
- Revenue $0.04B → $0.11B
1.17% of global revenue is generated in Mexico; USD 0.035 billion in 2025, reaching USD 0.11 billion in 2034, and 23.33% of Latin America.
Middle East and Africa Market Analysis
The 4th-largest region covered — 0.5 points of share move elsewhere by 2034, while revenue still grows 2.5×.
- Rank 4 of 5
- 2025 share 7%
- By 2034 6.5%
- Revenue $0.21B → $0.52B
Middle East and Africa holds 7% of the global microgreens market in 2025, worth USD 0.21 billion rising to USD 0.519 billion in 2034. It is a marginal region on this axis, fourth by revenue throughout the period.
6.5% of global revenue sits here in 2034, below the 2025 level, though revenue still rises throughout; the shift is in the region's weight against faster-growing ones, which is not the same as weakening demand.
Segment composition follows the global pattern: Broccoli largest at 18% of 2025 revenue, Sunflower fastest at 13.42%. Per-axis and per-country detail for Middle East and Africa sits in the full report.
United Arab Emirates
The largest market in Middle East and Africa, growing 2.4×.
- In region 1 of 2
- Of region 23.8%
- Of global 1.7%
- Revenue $0.05B → $0.12B
23.81% of Middle East and Africa's base-year revenue comes from the United Arab Emirates; USD 0.05 billion, rising to USD 0.12 billion by 2034. At 23.81% of the region in 2025 it leads, but a majority of Middle East and Africa's revenue is generated in other markets. Set against USD 0.21 billion and USD 0.519 billion for the region, it is why this market, and not a smaller one, is the one reported in full.
Demand in the United Arab Emirates follows the type mix reported at global level: Broccoli is the largest line at 18% of 2025 revenue, moving to 15.5% by 2034, while Sunflower grows fastest at 13.42% and takes its share from 15% to 17.5%. Its 23.81% weight in Middle East and Africa means those movements carry straight into the regional totals. The United Arab Emirates carries its own type breakdown in the full report.
Food safety is shared between federal and emirate-level bodies. The Ministry of Climate Change and Environment oversees agriculture and plant health at the federal level, while local authorities such as Dubai Municipality and the Abu Dhabi Agriculture and Food Safety Authority license food establishments and inspect them. Farms and distributors must register, and products must comply with Gulf Standardization Organization technical regulations on food safety, contaminants and pesticide residues. Packaged product requires labelling in Arabic, with producer details and storage instructions. Imported seed and produce need phytosanitary certificates and pass border inspection. Organic claims require recognised certification.
Competition in the United Arab Emirates runs between the suppliers this study tracks: Gotham Greens Holdings, PBC, AeroFarms, Fresh Origins, LLC, Ball Horticultural Company, Sakata Seed Corporation, Bowery Farming Inc., Edenworks, Madar Farms, Living Earth Farm, Chef's Garden, Inc., Shoots & Roots, Urban Cultivator, Farmbox Greens, Rocket Gardens, Square Roots, Eat Your Microgreens, Italian Sprout, Beekenkamp Group, Kaizen Microgreens, Bright Farms, Inc., Pete's Living Greens and Garden Fresh Microgreens. Two different problems sit on the same axis: holding Broccoli at 18% of 2025 revenue, and taking Sunflower while it grows at 13.42%. The commercial size of that position is USD 0.21 billion in 2025, moving to USD 0.519 billion by 2034 across the forecast period.
South Africa
2nd-largest in Middle East and Africa, growing 2.7×.
- In region 2 of 2
- Of region 14.3%
- Of global 1%
- Revenue $0.03B → $0.08B
South Africa is sized at USD 0.03 billion in 2025, rising to USD 0.08 billion by 2034; 1% of global revenue and 14.29% of Middle East and Africa. It is reported separately from the United Arab Emirates across every segmentation axis in the full report.
Download a free sample to see the full data tables and segment-level detail behind this analysis.
Report Coverage
This report assesses the market across every segment, with revenue and a growth rate for each line in each year of the study period. It covers the drivers, trends, opportunities, restraints and challenges shaping growth, the competitive landscape and the companies profiled, and the research methodology behind every estimate. Segmentation is reported by type, farming method, growing medium, form, distribution channel, end user, application, nature, packaging format, seed source, grower scale, and regional analysis covers North America, Europe, Asia Pacific, Latin America, Middle East and Africa, each broken out by country.
Competitive Landscape
Suppliers Compete on Broccoli Volume and Sunflower Momentum
The field covered here is Gotham Greens Holdings, PBC, AeroFarms, Fresh Origins, LLC, Ball Horticultural Company, Sakata Seed Corporation, Bowery Farming Inc., Edenworks, Madar Farms, Living Earth Farm, Chef's Garden, Inc., Shoots & Roots, Urban Cultivator, Farmbox Greens, Rocket Gardens, Square Roots, Eat Your Microgreens, Italian Sprout, Beekenkamp Group, Kaizen Microgreens, Bright Farms, Inc., Pete's Living Greens and Garden Fresh Microgreens.
Where suppliers actually compete is along the type axis. The largest block of revenue is Broccoli: USD 0.54 billion in 2025 at 18% of the total, 15.5% in 2034. Incumbency there is expensive to challenge. Share moves in Sunflower, growing 13.42% against 9.65% for Broccoli. Those are different problems, and a supplier strong in one is not thereby strong in the other; that is what sustains a field this size in a USD 3 billion market.
Suppliers separate on supply reliability, because a crop that spoils within days punishes any missed delivery. Larger growers hold advantages in controlled-environment capacity, food-safety audit credentials that major retailers require, cold-chain reach and the ability to hold year-round contracts with retailers and distributors. Seed suppliers compete on germination consistency and variety range. Smaller and regional growers compete on freshness, local delivery, custom varieties for chefs and direct relationships with restaurants and farmers markets. Private-label supply to supermarkets is growing, and it favours producers able to guarantee volume and consistent quality across many stores.
Presence matters unevenly by region. With 33% of 2025 revenue in North America and 28% in Asia Pacific, a supplier's coverage of those two decides most of its addressable base before any product question arises.
The full report carries a profile, financials, share and development history for each company named; none of that is in this summary.
List of Key Microgreens Market Companies Profiled
22 companies profiled. Company profiles, including financials, product portfolios and recent developments, are part of the full report.
- Gotham Greens Holdings, PBC(United States)
- AeroFarms(United States)
- Fresh Origins, LLC(United States)
- Ball Horticultural Company(United States)
- Sakata Seed Corporation(Japan)
- Bowery Farming Inc.(United States)
- Edenworks(United States)
- Madar Farms(United States)
- Living Earth Farm(United States)
- Chef's Garden, Inc.(United States)
- Shoots & Roots
- Urban Cultivator(Canada)
- Farmbox Greens(United States)
- Rocket Gardens(United Kingdom)
- Square Roots(United States)
- Eat Your Microgreens
- Italian Sprout
- Beekenkamp Group(Netherlands)
- Kaizen Microgreens
- Bright Farms, Inc.(United States)
- Pete's Living Greens(United States)
- Garden Fresh Microgreens
Geographic Coverage
Every market below is broken out separately in the report.
North America
3Europe
8Asia Pacific
12Latin America
3Middle East and Africa
4Key Insights
Report Scope
Study parameters & segmentationThis study covers market size and forecasts over the 2020–2034 period, segmentation across 11 axes (Type, Farming Method, Growing Medium, Form, Distribution Channel, End User, Application, Nature, Packaging Format, Seed Source, Grower Scale), regional analysis for 5 regions and their constituent countries, a competitive landscape profiling 22 key companies, and the research methodology behind every estimate.
Segmentation
11 axes + regionQuestions This Report Answers
6 questionsWhat is the market size and growth rate, globally and by region?
How is the market segmented, and which segments lead?
Which regions and countries are covered, and how do they compare?
What are the key drivers, restraints, opportunities and challenges?
Who are the leading companies operating in this market?
What trends are expected to shape the market through the forecast period?
Frequently Asked Questions
01What is the Microgreens Market projected to reach?
USD 7.98 USD Billion by 2034, CAGR 11.5%
02What years does this report cover?
Study period 2020–2034, base year 2025, historical data 2020-2024, forecast period 2026-2034.
03Which regions are covered?
North America, Europe, Asia Pacific, Latin America, Middle East and Africa.
04Which region accounted for the largest market share?
North America leads with 33% of global revenue through 2034.
05Which segment leads the market?
Broccoli is the largest line by type, at 18% of revenue in 2025.
06Who are the key companies profiled?
Gotham Greens Holdings, PBC, AeroFarms, Fresh Origins, LLC, Ball Horticultural Company, Sakata Seed Corporation, Bowery Farming Inc., Edenworks, Madar Farms, Living Earth Farm, Chef's Garden, Inc., Shoots & Roots, Urban Cultivator, Farmbox Greens, Rocket Gardens, Square Roots, Eat Your Microgreens, Italian Sprout, Beekenkamp Group, Kaizen Microgreens, Bright Farms, Inc., Pete's Living Greens, Garden Fresh Microgreens. Full profiles are part of the paid report.
07Can the segmentation be customized?
Yes. Custom data cuts by geography, segment, or competitor set are available on request.
Why choose CDI
Need this report shaped around your question?
The scope isn't fixed. Tell us what your team needs that the standard edition doesn't cover, and an analyst will come back on what can be adjusted and how long it takes, before you commit to anything.
Most licences include 30–60 hours of customization at no extra cost. See what each licence includes
Additional Companies
Add competitors, suppliers or the peer set you benchmark against to the companies already covered.
Deeper Competitive View
Sharpen the landscape work around your own position: product line, channel, or a named shortlist of rivals.
Extra Segment Splits
Break the market down along an axis the standard scope doesn't cut it by, or go a level deeper inside one.
Application Focus
Narrow the analysis to the specific use cases and end users your team actually sells into.
Different Time Frame
Move the base year, or widen the historical and forecast windows the study is built on.
Country-Level Detail
Go below region level into the individual countries that matter to you, rather than the standard geography split.