
Human Resource Technology MarketSize, Share & Industry Analysis, 2026-2034By ComponentBy Solution TypeBy Deployment ModeBy Organization SizeBy TechnologyBy Pricing ModelBy Vendor TypeBy Workforce TypeBy End-use IndustryBy Sales Channel
Full title & scope — all 10 axes with their segments
Human Resource Technology Market Size, Share & Industry Analysis, By Component (Software, Services), By Solution Type (Core HR and Employee Records, Talent Acquisition, Talent Management, Workforce Management, Payroll and Global Payroll, Learning and Development, Employee Engagement and Experience, People Analytics), By Deployment Mode (Cloud, On-Premises, Hybrid), By Organization Size (Large Enterprises, Medium Enterprises, Small Enterprises), By Technology (Artificial Intelligence and Machine Learning, Robotic Process Automation, Cloud Computing, Mobile Applications, Blockchain and Credential Verification, Chatbots and Virtual Assistants), By Pricing Model (Subscription, Tiered Subscription, Perpetual License, Usage or Transaction-Based), By Vendor Type (Suite Vendors, Best-of-Breed Specialists, Payroll and HR Outsourcing Providers, Professional Employer Organizations), By Workforce Type (Salaried and Full-Time Employees, Hourly and Frontline Workers, Contingent and Gig Workers, Remote and Hybrid Workers), By End-use Industry (BFSI, IT and Telecom, Healthcare and Life Sciences, Retail and Consumer Goods, Manufacturing, Government and Public Sector, Education, Hospitality and Transportation), By Sales Channel (Direct Sales, Channel Partners and Resellers, Online Marketplaces and Self-Service), and Regional Forecast, 2026-2034
Market outlook, key takeaways, drivers and challenges for the report period.
- 01By ComponentSoftware · Services
- 02By Solution TypeCore HR and Employee Records · Talent Acquisition · Talent Management
- 03By Deployment ModeCloud · On-Premises · Hybrid
- 04By Organization SizeLarge Enterprises · Medium Enterprises · Small Enterprises
- 05By TechnologyArtificial Intelligence and Machine Learning · Robotic Process Automation · Cloud Computing
- 06By Pricing ModelSubscription · Tiered Subscription · Perpetual License
- 07By Vendor TypeSuite Vendors · Best-of-Breed Specialists · Payroll and HR Outsourcing Providers
- 08By Workforce TypeSalaried and Full-Time Employees · Hourly and Frontline Workers · Contingent and Gig Workers
- 09By End-use IndustryBFSI · IT and Telecom · Healthcare and Life Sciences
- 10By Sales ChannelDirect Sales · Channel Partners and Resellers · Online Marketplaces and Self-Service
- 11By Region
Market Analysis & Outlook
Human resource technology covers software and related services that employers use to manage their workforce across the employee lifecycle, from recruiting and onboarding to payroll, scheduling, learning and performance. It is delivered as hosted platforms, installed systems or hybrids, and is sold as full suites or as single-purpose applications. Buyers range from small businesses with no dedicated HR staff to multinational employers and public bodies.
Between 2025 and 2034 the global human resource technology market moves from USD 40 billion to USD 87 billion, compounding at 8.9% a year. Fifteen years are covered in all, taking in USD 25 billion in 2020, USD 36.4 billion in 2024, USD 44 billion in 2026 and USD 63 billion in 2030.
On the component axis, growth rates run from 7.37% for Services up to 9.74% for Software. Software carries the volume: USD 24.8 billion and 62% of revenue in 2025, USD 57.86 billion and 66.5% in 2034. The lines gaining share are Software. Services lose share without losing revenue.
By solution type, Payroll and Global Payroll accounts for 19% of 2025 revenue at USD 7.6 billion, reaching USD 14.4 billion and 16.55% by 2034. People Analytics grows faster at 12.98% against 7.36%, moving from 6% of revenue to 8.28% by 2034. This axis divides the same revenue as the component split instead of adding to it, so the two are read together and never summed.
North America is the largest region at 38% of 2025 revenue, worth USD 15.2 billion and reaching USD 30.62 billion by 2034. Asia Pacific follows at 27%, moving from USD 10.8 billion to USD 27.49 billion, and Middle East and Africa is the smallest at 5.5%. Because Asia Pacific take share, the revenue added by 2034 concentrates instead of spreading across all five regions.
Coverage extends to five regions, two component lines and ten segmentation axes over the full fifteen years. The 2025 total itself is arrived at by triangulating published aggregates against category proxies, not by an independent count, and the splits below are estimated on that same basis, a bound on their precision worth carrying into any use of them.
Market Size, 2020–2034
USD BillionRevenue in USD Billion. Values up to 2025 are actuals; 2026–2034 are forecast.
Key Takeaways
- The global human resource technology market moves from USD 25 billion in 2020 to USD 40 billion in 2025 and USD 87 billion by 2034, the forecast period compounding at 8.9% a year.
- Software is the largest component line at USD 24.8 billion in 2025, a 62% share, reaching USD 57.86 billion and 66.5% of revenue by 2034.
- Against a base case of USD 87 billion in 2034, the study also reports a bear case at USD 75.3 billion and a bull case at USD 96 billion, with the assumptions behind each set out separately.
- 38% of 2025 revenue is generated in North America, worth USD 15.2 billion and rising to USD 30.62 billion by 2034; Middle East and Africa is smallest at 5.5%.
- Within North America, the United States is the worked country example, at USD 13.3 billion in 2025; 87.5% of regional revenue in the base year, and USD 26.6 billion by 2034.
- Every line on all ten segmentation axes and in each of the five regions carries its own revenue, share and growth rate for all fifteen years, 2020 through 2034, on a 2025 base.
Market Trends
Revenue Share, By component
Base year 2025Software leads with 62.0% of component segment revenue.
Share of component segment revenue, most recent base year.
Three things move over 2026-2034, and they are worth separating: the component mix, the regional balance, and the 8.9% compounding underneath both.
Not one of them points downward. Growth is everywhere in absolute terms, and the interest is entirely in where it lands.
Software grows faster than Services. 9.74% against 7.37%: that gap, between Software and Services, is the largest on the component axis. Software takes its share of revenue from 62% to 66.5% while Services gives up ground, from 38% to 33.5%. Revenue rises on both sides; USD 24.8 billion to USD 57.86 billion and USD 15.2 billion to USD 29.14 billion respectively, so this is a change in composition, not a contraction, and one forecast window is long enough for it to matter.
The regional balance moves. Asia Pacific moves from 27% of revenue in 2025 to 31.6% in 2034, worth USD 10.8 billion rising to USD 27.49 billion. The remaining regions grow in absolute terms while giving up share: North America at 38% moving to 35.2%, Europe at 24% moving to 22.2%, Latin America at 5.5% moving to 5.5%, Middle East and Africa at 5.5% moving to 5.5%. The practical consequence is that regional weighting decides whether a participant matches the market rate or trails it, regardless of how its own revenue reads.
A continuation, not an inflection. The market moves through USD 25 billion in 2020, USD 36.4 billion in 2024, USD 40 billion in 2025, USD 44 billion in 2026, USD 63 billion in 2030 and USD 87 billion in 2034. No year breaks the trajectory, and the 8.9% forecast rate compares with 9.86% recorded over 2020-2025, a continuation, not an inflection. That moves the planning question away from timing a turn and onto the component and regional mixes, where the actual movement is.
Market Growth Factors
The fastest line decides the blended rate
Market Drivers
3- 01The fastest line decides the blended rate
The fastest line on the component axis is Software, at 9.74% against the market's 8.9%, taking USD 24.8 billion to USD 57.86 billion and 62% of revenue to 66.5%. The market's overall 8.9% depends on that rate holding: at the 7.37% recorded by Services, the same revenue base would compound to a materially smaller 2034 total. Exposure to this line, not to the market as a whole, is what determines a supplier's own rate.
- 02Growth lands where the revenue already is
North America is the largest region at USD 15.2 billion in 2025, 38% of global revenue, and reaches USD 30.62 billion by 2034 while holding 35.2%. Behind it, Asia Pacific holds 27%; USD 10.8 billion rising to USD 27.49 billion. Because both the existing revenue and the revenue added concentrate in these two, regional weighting matters more to a forecast than regional count does.
- 03The base has grown every year since 2020
The historical period compounded at 9.86%; USD 25 billion in 2020, USD 36.4 billion in 2024 and USD 40 billion in 2025. The forecast period then runs at 8.9%, ending 2034 at USD 87 billion. Because the growth is already in the record and not only in the projection, the rate is held flat across the forecast instead of ramped, and the risk in the number sits in the mix assumptions, not in whether the market grows at all.
Growth drivers
| # | Growth driver | Impact | Gross contribution (USD Billion) | 2026-28 | 2029-31 | 2032-34 |
|---|---|---|---|---|---|---|
| 1 | AI-enabled automation of HR workflows | High | +14 | High | High | Medium |
| 2 | Migration from legacy HR systems to cloud platforms | High | +11 | High | Medium | Medium |
| 3 | Skills shortages and talent mobility | Medium-High | +8.5 | Medium | High | Medium |
| 4 | Payroll and compliance complexity across borders | Medium | +7.5 | Medium | Medium | Medium |
| 5 | Demand for workforce analytics and engagement tools | Medium | +5 | Low | Medium | High |
| 6 | Others | Low | +4 | Low | Low | Low |
| Total | +50 | |||||
Restraints
| # | Restraint | Impact | Estimated reduction (USD Billion) | 2026-28 | 2029-31 | 2032-34 |
|---|---|---|---|---|---|---|
| 1 | Data privacy and automated decision rules | Medium-High | −1.4 | High | Medium | Medium |
| 2 | Implementation cost and data migration effort for smaller employers | Medium | −1 | Medium | Medium | Low |
| 3 | Vendor consolidation and price pressure | Low | −0.6 | Low | Medium | Medium |
| Total | −3 | |||||
Drivers contribute 50 USD Billion and restraints remove 3 USD Billion, a net 47 USD Billion, which is the revenue the market adds between the base year and 2034. Contributions are CDI estimates, apportioned so that they reconcile with the forecast rather than being read from it.
Three sources account for the growth to 2034: 8.9% compounding across the base, share moving toward the faster component lines, and above-market expansion in the leading regions.
Restraining Factors
Downside case: USD 75.3 billion by 2034, against USD 87 billion in the base case
Market Restraints
2- 01Downside case: USD 75.3 billion by 2034, against USD 87 billion in the base case
Hiring stays weak, vendor consolidation and price competition limit revenue per employee, and stricter rules on automated hiring slow the rollout of AI features. On that assumption 2034 revenue lands at USD 75.3 billion against the USD 87 billion base case, from the same USD 40 billion 2025 starting point.
- 02The largest line is not the fastest
Services carries 38% of 2025 revenue at USD 15.2 billion but compounds at 7.37% against 8.9% for the market, taking its share to 33.5% by 2034 even as revenue rises to USD 29.14 billion. Because it carries that much of the base, its pace holds the blended rate down more than any faster line lifts it.
Market Opportunities
Where the forecast could be beaten
Market Opportunities
2- 01Where the forecast could be beaten
A bull case of USD 96 billion by 2034, against USD 87 billion in the base case, turns on a single stated assumption: AI features are adopted faster and priced as paid add-ons, white-collar hiring recovers, and small employers move to hosted platforms sooner than expected. The USD 40 billion 2025 base is common to both.
- 02Software share moves from 62% to 66.5%
Share on the component axis moves toward Software, from 62% in 2025 to 66.5% in 2034, on 9.74% growth against the market's 8.9% and revenue rising from USD 24.8 billion to USD 57.86 billion. Taking position there does not require displacing whoever holds Software, which is the harder and more expensive fight.
Market Challenges
Revenue is concentrated in Software
Market Challenges
2- 01Revenue is concentrated in Software
With 62% of 2025 revenue and 66.5% of 2034 revenue (USD 24.8 billion rising to USD 57.86 billion) Software is where the market's exposure sits. Anything that changes demand for it changes the headline number; nothing else on the axis carries that weight.
- 02One country drives the leading region
Of North America's USD 15.2 billion in 2025, USD 13.3 billion (87.5%) comes from the United States alone, rising to USD 26.6 billion by 2034. Read as a region it looks diversified; read by weight it is not, and the regional forecast inherits whatever happens in that one market.
Segmentation Analysis
10 axesten segmentation axes are reported; by component, by solution type, deployment mode, organization size, technology, pricing model, vendor type, workforce type, end-use industry and sales channel. Revenue does not add across them: each is a different cut of the same total.
There are two lines on the component axis, and all of them grow in revenue between 2025 and 2034. What separates them is share: one gains it, the other gives it up.
By Component · 2 segments
Software Holds the Largest Component Share and Is Still the Quickest to Grow
- Largest Software · 62%
- Fastest Software · 9.7%
- Moves most Software · +4.5 pts
- Order by 2034 unchanged
| Segment | 2025 | Share | 2034 | Share | CAGR |
|---|---|---|---|---|---|
| Software | $24.80B | 62% | $57.86B | 66.5%+4.5 | 9.7% |
| Services | $15.20B | 38% | $29.14B | 33.5%-4.5 | 7.4% |
Software leads because HR spend has moved from licensed installations to subscription platforms that cover several functions in one contract, and each added module raises the revenue per employee. Services grow more slowly since implementation work is largely one-off, while the fastest software growth comes from automation features sold as upgrades to existing customers. The order does not change: Software is still largest in 2034, and what moves is how much it holds. Every year of the series is priced on this axis, making it the reference cut for the rest of the report.
By Solution Type · 8 segments
By Solution Type
- Largest Payroll and Global Payroll · 19%
- Fastest People Analytics · 13%
- Moves most Payroll and Global Payroll · -2.4 pts
- Order by 2034 changes
| Segment | 2025 | Share | 2034 | Share | CAGR |
|---|---|---|---|---|---|
| Core HR and Employee Records | $7.20B | 18% | $14B | 16.1%-1.9 | 7.7% |
| Talent Acquisition | $6.40B | 16% | $14.50B | 16.7%+0.7 | 9.5% |
| Talent Management | $5.60B | 14% | $11.60B | 13.3%-0.7 | 8.4% |
| Workforce Management | $5.20B | 13% | $10.90B | 12.5%-0.5 | 8.6% |
| Payroll and Global Payroll | $7.60B | 19% | $14.40B | 16.6%-2.4 | 7.4% |
| Learning and Development | $3.20B | 8% | $8B | 9.2%+1.2 | 10.7% |
| Employee Engagement and Experience | $2.40B | 6% | $6.40B | 7.4%+1.4 | 11.5% |
| People Analytics | $2.40B | 6% | $7.20B | 8.3%+2.3 | 13% |
2025 to 2034 revenue and share by line: Payroll and Global Payroll USD 7.6 billion to USD 14.4 billion (19% to 16.55%), Core HR and Employee Records USD 7.2 billion to USD 14 billion (18% to 16.09%), Talent Acquisition USD 6.4 billion to USD 14.5 billion (16% to 16.67%), Talent Management USD 5.6 billion to USD 11.6 billion (14% to 13.33%), Workforce Management USD 5.2 billion to USD 10.9 billion (13% to 12.53%), Learning and Development USD 3.2 billion to USD 8 billion (8% to 9.2%), Employee Engagement and Experience USD 2.4 billion to USD 6.4 billion (6% to 7.36%), People Analytics USD 2.4 billion to USD 7.2 billion (6% to 8.28%). People Analytics Outpaces the Axis While Payroll and Global Payroll Holds the Largest Share Payroll and core records lead because every employer needs them first and they anchor the contract that other modules are added to. People analytics grows fastest from a small base as employers seek evidence for workforce decisions, with engagement and learning tools following as retention and reskilling become board-level concerns. Leadership changes hands: Talent Acquisition is the largest line by 2034, not Payroll and Global Payroll.
By Deployment Mode · 3 segments
Hybrid Outpaces the Axis While Cloud Holds the Largest Share
- Largest Cloud · 73%
- Fastest Hybrid · 12.4%
- Moves most On-Premises · -9.5 pts
- Order by 2034 changes
| Segment | 2025 | Share | 2034 | Share | CAGR |
|---|---|---|---|---|---|
| Cloud | $29.20B | 73% | $69B | 79.3%+6.3 | 10% |
| On-Premises | $6.80B | 17% | $6.50B | 7.5%-9.5 | -0.5% |
| Hybrid | $4B | 10% | $11.50B | 13.2%+3.2 | 12.4% |
Cloud leads because vendors now build new features for hosted platforms only, and buyers avoid the upgrade projects that on-premises systems demand. Hybrid grows fastest as regulated and public employers keep sensitive records in controlled environments while moving other functions out. On-premises installations decline as support is wound down. The order does not change: Cloud is still largest in 2034, and what moves is how much it holds.
By Organization Size · 3 segments
Large Enterprises Led by Organization size in 2025, with Small Enterprises Growing Fastest
- Largest Large Enterprises · 55%
- Fastest Small Enterprises · 10.7%
- Moves most Large Enterprises · -4.4 pts
- Order by 2034 unchanged
| Segment | 2025 | Share | 2034 | Share | CAGR |
|---|---|---|---|---|---|
| Large Enterprises | $22B | 55% | $44B | 50.6%-4.4 | 8% |
| Medium Enterprises | $10.80B | 27% | $25B | 28.7%+1.7 | 9.8% |
| Small Enterprises | $7.20B | 18% | $18B | 20.7%+2.7 | 10.7% |
Large enterprises lead because they run the most employees across several countries and buy the widest module sets. Small enterprises grow fastest as self-service platforms with low entry prices let firms without an HR department replace spreadsheets, and as bundled payroll and benefits offers reach them through online channels. Large Enterprises remains the largest line through 2034, so the axis changes in proportion, not in order.
By Technology · 6 segments
Cloud Computing Held the Dominant Share of the Technology Segment in 2025
- Largest Cloud Computing · 35%
- Fastest Artificial Intelligence and Machine Learning · 14%
- Moves most Artificial Intelligence and Machine Learning · +9.9 pts
- Order by 2034 unchanged
| Segment | 2025 | Share | 2034 | Share | CAGR |
|---|---|---|---|---|---|
| Artificial Intelligence and Machine Learning | $8B | 20% | $26B | 29.9%+9.9 | 14% |
| Robotic Process Automation | $5B | 12.5% | $10B | 11.5%-1 | 8% |
| Cloud Computing | $14B | 35% | $27B | 31%-4 | 7.6% |
| Mobile Applications | $6.50B | 16.3% | $11B | 12.6%-3.6 | 6% |
| Blockchain and Credential Verification | $1.50B | 3.8% | $4B | 4.6%+0.8 | 11.5% |
| Chatbots and Virtual Assistants | $5B | 12.5% | $9B | 10.3%-2.2 | 6.8% |
Cloud computing leads because it is the base layer under nearly every hosted HR product and is counted wherever a platform is delivered that way. Artificial intelligence and machine learning grow fastest as vendors embed screening, drafting and forecasting features into core workflows, while blockchain verification stays a niche add-on. The order does not change: Cloud Computing is still largest in 2034, and what moves is how much it holds.
By Pricing Model · 4 segments
Subscription (Per Employee Per Month) Led by Pricing model in 2025, with Usage or Transaction-Based Growing Fastest
- Largest Subscription (Per Employee Per Month) · 55%
- Fastest Usage or Transaction-Based · 12.6%
- Moves most Perpetual License · -6.7 pts
- Order by 2034 unchanged
| Segment | 2025 | Share | 2034 | Share | CAGR |
|---|---|---|---|---|---|
| Subscription (Per Employee Per Month) | $22B | 55% | $47B | 54%-1 | 8.8% |
| Tiered Subscription | $8B | 20% | $20B | 23%+3 | 10.7% |
| Perpetual License | $4.50B | 11.3% | $4B | 4.6%-6.7 | -1.3% |
| Usage or Transaction-Based | $5.50B | 13.8% | $16B | 18.4%+4.6 | 12.6% |
Per-employee subscriptions lead because they match how employers budget for HR and let vendors expand revenue as headcount and modules grow. Usage-based pricing grows fastest in payroll runs, background checks and verification, where volumes vary. Perpetual licences shrink as buyers move away from upfront capital outlay. The order does not change: Subscription (Per Employee Per Month) is still largest in 2034, and what moves is how much it holds.
By Vendor Type · 4 segments
Suite Vendors Held the Dominant Share of the Vendor type Segment in 2025
- Largest Suite Vendors · 50%
- Fastest Professional Employer Organizations · 11.5%
- Moves most Best-of-Breed Specialists · +2.8 pts
- Order by 2034 unchanged
| Segment | 2025 | Share | 2034 | Share | CAGR |
|---|---|---|---|---|---|
| Suite Vendors | $20B | 50% | $42B | 48.3%-1.7 | 8.6% |
| Best-of-Breed Specialists | $9B | 22.5% | $22B | 25.3%+2.8 | 10.4% |
| Payroll and HR Outsourcing Providers | $8B | 20% | $15B | 17.2%-2.8 | 7.2% |
| Professional Employer Organizations | $3B | 7.5% | $8B | 9.2%+1.7 | 11.5% |
Suite vendors lead because large buyers prefer one contract and one employee record across functions. Best-of-breed specialists grow faster by winning on depth in single areas such as recruiting or engagement, and by integrating with the suites. Employer-of-record style providers grow as small firms hire across borders. Professional Employer Organizations outgrows every other line on this axis, narrowing the gap to Suite Vendors. The order does not change: Suite Vendors is still largest in 2034, and what moves is how much it holds.
By Workforce Type · 4 segments
Hourly and Frontline Workers Outpaces the Axis While Salaried and Full-Time Employees Holds the Largest Share
- Largest Salaried and Full-Time Employees · 52.5%
- Fastest Hourly and Frontline Workers · 11.3%
- Moves most Salaried and Full-Time Employees · -8.8 pts
- Order by 2034 unchanged
| Segment | 2025 | Share | 2034 | Share | CAGR |
|---|---|---|---|---|---|
| Salaried and Full-Time Employees | $21B | 52.5% | $38B | 43.7%-8.8 | 6.8% |
| Hourly and Frontline Workers | $9.50B | 23.8% | $25B | 28.7%+5 | 11.3% |
| Contingent and Gig Workers | $3.50B | 8.8% | $9B | 10.3%+1.6 | 11.1% |
| Remote and Hybrid Workers | $6B | 15% | $15B | 17.2%+2.2 | 10.7% |
Salaried and full-time staff lead because they carry the full set of HR processes, from onboarding to performance and benefits. Hourly and frontline workers grow fastest as scheduling, time capture and mobile access reach retail, logistics and care settings that previously relied on paper or basic timekeeping. The order does not change: Salaried and Full-Time Employees is still largest in 2034, and what moves is how much it holds.
By End-use Industry · 8 segments
By End-use Industry
- Largest BFSI · 17%
- Fastest Hospitality and Transportation · 11.6%
- Moves most Hospitality and Transportation · +1.6 pts
- Order by 2034 changes
| Segment | 2025 | Share | 2034 | Share | CAGR |
|---|---|---|---|---|---|
| BFSI | $6.80B | 17% | $14B | 16.1%-0.9 | 8.3% |
| IT and Telecom | $6.40B | 16% | $14B | 16.1%+0.1 | 9.1% |
| Healthcare and Life Sciences | $5.60B | 14% | $13.50B | 15.5%+1.5 | 10.3% |
| Retail and Consumer Goods | $5.20B | 13% | $11B | 12.6%-0.4 | 8.7% |
| Manufacturing | $6B | 15% | $12B | 13.8%-1.2 | 8% |
| Government and Public Sector | $4.40B | 11% | $8.50B | 9.8%-1.2 | 7.6% |
| Education | $2.80B | 7% | $6.50B | 7.5%+0.5 | 9.8% |
| Hospitality and Transportation | $2.80B | 7% | $7.50B | 8.6%+1.6 | 11.6% |
2025 to 2034 revenue and share by line: BFSI USD 6.8 billion to USD 14 billion (17% to 16.09%), IT and Telecom USD 6.4 billion to USD 14 billion (16% to 16.09%), Manufacturing USD 6 billion to USD 12 billion (15% to 13.79%), Healthcare and Life Sciences USD 5.6 billion to USD 13.5 billion (14% to 15.52%), Retail and Consumer Goods USD 5.2 billion to USD 11 billion (13% to 12.64%), Government and Public Sector USD 4.4 billion to USD 8.5 billion (11% to 9.77%), Education USD 2.8 billion to USD 6.5 billion (7% to 7.47%), Hospitality and Transportation USD 2.8 billion to USD 7.5 billion (7% to 8.62%). Hospitality and Transportation Outpaces the Axis While BFSI Holds the Largest Share Financial services and IT lead because they employ large knowledge workforces with strict record keeping and a steady appetite for talent tools. Hospitality and transportation grow fastest as high turnover and shift-based staffing push operators toward automated hiring, scheduling and onboarding, with healthcare following on credentialing and staffing pressure. The order does not change: BFSI is still largest in 2034, and what moves is how much it holds.
By Sales Channel · 3 segments
Direct Sales Held the Dominant Share of the Sales channel Segment in 2025
- Largest Direct Sales · 65%
- Fastest Online Marketplaces and Self-Service · 14%
- Moves most Direct Sales · -5.2 pts
- Order by 2034 unchanged
| Segment | 2025 | Share | 2034 | Share | CAGR |
|---|---|---|---|---|---|
| Direct Sales | $26B | 65% | $52B | 59.8%-5.2 | 8% |
| Channel Partners and Resellers | $10B | 25% | $22B | 25.3%+0.3 | 9.2% |
| Online Marketplaces and Self-Service | $4B | 10% | $13B | 14.9%+4.9 | 14% |
Direct sales lead because enterprise HR platforms involve long evaluations, configuration and contract negotiation that vendors handle themselves. Online self-service grows fastest as smaller employers sign up and pay without a sales process, and partners extend reach into regions where vendors have no local presence. Direct Sales remains the largest line through 2034, so the axis changes in proportion, not in order.
Regional Insights
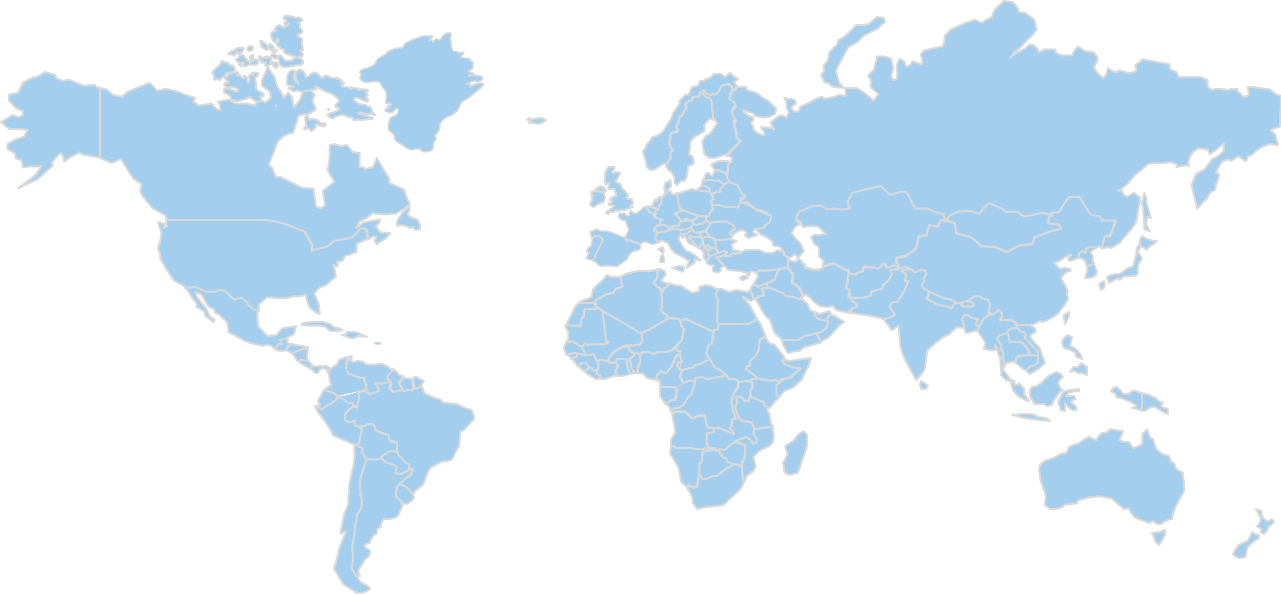
Regional Revenue Share
Base year 2025Share of global revenue in the base year.
Only the leading region's share is published outside the report; pins mark the region, not a specific country.
North America Market Analysis
The largest region covered — 2.8 points of share move elsewhere by 2034, while revenue still grows 2.0×.
- Rank 1 of 5
- 2025 share 38%
- By 2034 35.2%
- Revenue $15.20B → $30.62B
North America holds 38% of the global human resource technology market in 2025, worth USD 15.2 billion and reaches USD 30.62 billion by 2034. Among the five regions it ranks first by revenue in both years.
Share settles at 35.2% in 2034, a shift in share, not in direction: revenue climbs every year while the market's centre of gravity moves elsewhere.
Within the region the component split tracks the global one; 62% of 2025 revenue in Software, fastest growth of 9.74% in Software. Per-axis and per-country detail for North America sits in the full report.
United States
Sets the pace for North America at 87.5% of it, growing 2.0×.
- In region 1 of 2
- Of region 87.5%
- Of global 33.3%
- Revenue $13.30B → $26.60B
87.5% of North America's base-year revenue comes from the United States; USD 13.3 billion, rising to USD 26.6 billion by 2034. At 87.5% of regional revenue in the base year it is not one market among several, the region's trajectory is largely this country's trajectory. The region itself runs USD 15.2 billion to USD 30.62 billion over the same period, and this is the market carrying the country-level detail in the full report.
Demand in the United States follows the component mix reported at global level: Software is the largest line at 62% of 2025 revenue, moving to 66.5% by 2034, while Software grows fastest at 9.74% and takes its share from 62% to 66.5%. Its 87.5% weight in North America means those movements carry straight into the regional totals. The United States carries its own component breakdown in the full report.
Human resource technology is not licensed as a product in the United States, so no single approval body governs it. Suppliers answer to the Equal Employment Opportunity Commission, whose guidance on selection procedures reaches software used to screen and rank candidates, and to the Federal Trade Commission, which polices unfair or deceptive claims about what a tool does. Employers using automated hiring tools must meet anti-discrimination law, and several states and cities add their own rules, such as New York City's requirement for bias audits and candidate notice. Payroll and benefits modules fall under federal and state wage, tax and privacy statutes. Vendors typically evidence security through independent SOC reporting.
In the United States the field is Workday, Inc., SAP SE, Oracle Corporation, ADP, Inc., UKG Inc., Microsoft Corporation, Dayforce, Inc., Paycom Software, Inc., Paylocity Holding Corporation, Paycor HCM, Inc., Ultimate Kronos Group, Cornerstone OnDemand, Inc., iCIMS, Inc., SmartRecruiters, Inc., Workhuman, Inc., BambooHR, LLC, Rippling, Deel, Inc., Gusto, Inc., Zenefits (TriNet Group, Inc.), HiBob Ltd., Personio SE, Sage Group plc, Infor, Inc., Ramco Systems Ltd., Darwinbox Digital Solutions Pvt. Ltd., Greenhouse Software, Inc., Eightfold AI, Inc., Beamery, Inc., Culture Amp Pty Ltd, Qualtrics International Inc., Alight, Inc., Employment Hero Pty Ltd and Zoho Corporation Pvt. Ltd.. Software is both the largest line, at 62% of 2025 revenue, and the fastest-growing at 9.74%. The full report covers country-level positioning and shares company by company; this summary does not.
Canada
2nd-largest in North America, growing 2.1×.
- In region 2 of 2
- Of region 9.2%
- Of global 3.5%
- Revenue $1.40B → $2.95B
Canada is sized at USD 1.4 billion in 2025, rising to USD 2.95 billion by 2034; 3.5% of global revenue and 9.21% of North America. It is reported separately from the United States across every segmentation axis in the full report.
Europe Market Analysis
The 3rd-largest region covered — 1.8 points of share move elsewhere by 2034, while revenue still grows 2.0×.
- Rank 3 of 5
- 2025 share 24%
- By 2034 22.2%
- Revenue $9.60B → $19.31B
In Europe, 24% of global revenue puts 2025 at USD 9.6 billion with USD 19.31 billion projected for 2034. That makes it the third-largest region covered, in 2025 and again in 2034.
Share settles at 22.2% in 2034, and the region keeps growing in absolute terms while others expand faster, a change in relative weight, not a decline in demand.
Segment composition follows the global pattern: Software largest at 62% of 2025 revenue, Software fastest at 9.74%. Per-axis and per-country detail for Europe sits in the full report.
Germany
The largest market in Europe, growing 1.9×.
- In region 1 of 3
- Of region 25%
- Of global 6%
- Revenue $2.40B → $4.60B
The largest single market in Europe is Germany, at USD 2.4 billion in 2025 and USD 4.6 billion in 2034. It accounts for 25% of regional revenue in the base year, the largest single share without dominating the region outright. Regional revenue of USD 9.6 billion in 2025 and USD 19.31 billion in 2034 sits around it, and it is the country used wherever the full report cuts a figure by geography.
Demand in Germany follows the component mix reported at global level: Software is the largest line at 62% of 2025 revenue, moving to 66.5% by 2034, while Software grows fastest at 9.74% and takes its share from 62% to 66.5%. Its 25% weight in Europe means those movements carry straight into the regional totals. Per-component revenue for Germany appears on its own in the full report.
In Germany, human resource technology is governed mainly by data protection law rather than by a product approval scheme. The General Data Protection Regulation applies directly, supplemented by the Federal Data Protection Act, which sets specific conditions for processing employee data. Supervisory authorities in each federal state enforce these rules. Works councils hold co-determination rights under the Works Constitution Act over systems able to monitor employee behaviour or performance, so a supplier's customer usually needs a works agreement before deployment. The EU Artificial Intelligence Act classes recruitment and worker-management systems as high risk, requiring conformity assessment, documentation and human oversight from suppliers.
Competition in Germany runs between the suppliers this study tracks: Workday, Inc., SAP SE, Oracle Corporation, ADP, Inc., UKG Inc., Microsoft Corporation, Dayforce, Inc., Paycom Software, Inc., Paylocity Holding Corporation, Paycor HCM, Inc., Ultimate Kronos Group, Cornerstone OnDemand, Inc., iCIMS, Inc., SmartRecruiters, Inc., Workhuman, Inc., BambooHR, LLC, Rippling, Deel, Inc., Gusto, Inc., Zenefits (TriNet Group, Inc.), HiBob Ltd., Personio SE, Sage Group plc, Infor, Inc., Ramco Systems Ltd., Darwinbox Digital Solutions Pvt. Ltd., Greenhouse Software, Inc., Eightfold AI, Inc., Beamery, Inc., Culture Amp Pty Ltd, Qualtrics International Inc., Alight, Inc., Employment Hero Pty Ltd and Zoho Corporation Pvt. Ltd.. Volume and growth sit in the same line, Software, at 62% of 2025 revenue and 9.74% growth. A supplier weighted toward Europe is competing over a base of USD 9.6 billion in 2025, reaching USD 19.31 billion by 2034 on the trajectory this study models.
United Kingdom
2nd-largest in Europe, growing 2.0×.
- In region 2 of 3
- Of region 21.9%
- Of global 5.3%
- Revenue $2.10B → $4.10B
The United Kingdom is sized at USD 2.1 billion in 2025, rising to USD 4.1 billion by 2034; 5.25% of global revenue and 21.88% of Europe. It is reported separately from Germany across every segmentation axis in the full report.
France
3rd-largest in Europe, growing 2.0×.
- In region 3 of 3
- Of region 15.1%
- Of global 3.6%
- Revenue $1.45B → $2.90B
3.63% of global revenue is generated in France; USD 1.45 billion in 2025, reaching USD 2.9 billion in 2034, and 15.1% of Europe.
Asia Pacific Market Analysis
The 2nd-largest region covered, and the one gaining the most — it picks up 4.6 points of share by 2034, while revenue still grows 2.5×.
- Rank 2 of 5
- 2025 share 27%
- By 2034 31.6%
- Revenue $10.80B → $27.49B
In Asia Pacific, 27% of global revenue puts 2025 at USD 10.8 billion on the way to USD 27.49 billion by 2034. That makes it the second-largest region covered, in 2025 and again in 2034.
31.6% of global revenue sits here by 2034, up from the 2025 level, so the region grows faster than the market's 8.9% and takes a larger part of the revenue added by 2034 than its 2025 weight implies.
Within the region the component split tracks the global one; 62% of 2025 revenue in Software, fastest growth of 9.74% in Software. Revenue for Asia Pacific is broken out by every segmentation axis and by country in the full report.
China
The largest market in Asia Pacific, growing 2.7×.
- In region 1 of 3
- Of region 36.1%
- Of global 9.8%
- Revenue $3.90B → $10.60B
China is the largest market within Asia Pacific, generating USD 3.9 billion in 2025 and projected to reach USD 10.6 billion by 2034. 36.11% of the region in the base year makes it the largest market here without making it the region. Against regional totals of USD 10.8 billion in 2025 and USD 27.49 billion in 2034, it is the country the full report breaks out in detail.
Demand in China follows the component mix reported at global level: Software is the largest line at 62% of 2025 revenue, moving to 66.5% by 2034, while Software grows fastest at 9.74% and takes its share from 62% to 66.5%. Its 36.11% weight in Asia Pacific means those movements carry straight into the regional totals. China carries its own component breakdown in the full report.
Human resource technology in China is regulated through cybersecurity and data law. The Cyberspace Administration of China oversees the Cybersecurity Law, the Data Security Law and the Personal Information Protection Law, which together require a lawful basis and separate consent for handling employee personal information. Transfers of such data abroad may require a security assessment or standard contract filing. Cloud-hosted services generally need the appropriate telecommunications value-added licence from the Ministry of Industry and Information Technology, and foreign suppliers often operate through a local partner. Recruitment platforms must also comply with labour law and rules on algorithmic recommendation services.
Workday, Inc., SAP SE, Oracle Corporation, ADP, Inc., UKG Inc., Microsoft Corporation, Dayforce, Inc., Paycom Software, Inc., Paylocity Holding Corporation, Paycor HCM, Inc., Ultimate Kronos Group, Cornerstone OnDemand, Inc., iCIMS, Inc., SmartRecruiters, Inc., Workhuman, Inc., BambooHR, LLC, Rippling, Deel, Inc., Gusto, Inc., Zenefits (TriNet Group, Inc.), HiBob Ltd., Personio SE, Sage Group plc, Infor, Inc., Ramco Systems Ltd., Darwinbox Digital Solutions Pvt. Ltd., Greenhouse Software, Inc., Eightfold AI, Inc., Beamery, Inc., Culture Amp Pty Ltd, Qualtrics International Inc., Alight, Inc., Employment Hero Pty Ltd and Zoho Corporation Pvt. Ltd. are the suppliers covered in China. One line leads on both counts here: Software holds 62% of 2025 revenue and compounds fastest at 9.74%. A supplier weighted toward Asia Pacific is competing over a base of USD 10.8 billion in 2025 reaching USD 27.49 billion by 2034, 27% of global revenue at the start of that period.
Japan
2nd-largest in Asia Pacific, growing 1.9×.
- In region 2 of 3
- Of region 15.7%
- Of global 4.3%
- Revenue $1.70B → $3.20B
Japan is sized at USD 1.7 billion in 2025, rising to USD 3.2 billion by 2034; 4.25% of global revenue and 15.74% of Asia Pacific. It is reported separately from China across every segmentation axis in the full report.
India
3rd-largest in Asia Pacific, growing 3.5×.
- In region 3 of 3
- Of region 14.8%
- Of global 4%
- Revenue $1.60B → $5.60B
Within Asia Pacific, India accounts for 14.81% of regional revenue and 4% of the global total, worth USD 1.6 billion in 2025 and USD 5.6 billion by 2034.
Latin America Market Analysis
The 4th-largest region covered, holding its share flat through 2034, while revenue still grows 2.2×.
- Rank 4 of 5
- 2025 share 5.5%
- By 2034 5.5%
- Revenue $2.20B → $4.79B
5.5% of the global human resource technology market sits in Latin America in 2025, worth USD 2.2 billion on the way to USD 4.79 billion by 2034. That makes it the fourth-largest region covered, in 2025 and again in 2034.
Its share moves to 5.5% by 2034, and the region keeps growing in absolute terms while others expand faster, a change in relative weight, not a decline in demand.
Segment composition follows the global pattern: Software largest at 62% of 2025 revenue, Software fastest at 9.74%. The full report breaks Latin America out along every axis and by country.
Brazil
The largest market in Latin America, growing 2.3×.
- In region 1 of 2
- Of region 45.5%
- Of global 2.5%
- Revenue $1B → $2.30B
The largest single market in Latin America is Brazil, at USD 1 billion in 2025 and USD 2.3 billion in 2034. At 45.45% of the region in 2025 it leads, but a majority of Latin America's revenue is generated in other markets. Set against USD 2.2 billion and USD 4.79 billion for the region, it is why this market, and not a smaller one, is the one reported in full.
Composition here matches the global split: the largest line is Software at 62% of 2025 revenue, easing to 66.5% by 2034, and the fastest is Software at 9.74%, from 62% to 66.5%. Since 45.45% of Latin America's revenue is generated here, the regional numbers inherit this market's mix instead of smoothing it out. The full report reports Brazil by component separately.
Brazil has no dedicated approval route for human resource technology. The central instrument is the General Data Protection Law, enforced by the National Data Protection Authority, which requires a legal basis for processing employee and candidate data, transparency about purpose, and safeguards for sensitive categories. Suppliers acting as data processors must follow the controller's instructions and maintain security measures and incident reporting. Employment matters fall under the Consolidation of Labour Laws, and payroll and tax reporting obligations are tied to the federal digital reporting systems, which software must support. Digital time-recording systems are subject to rules from the labour ministry.
Workday, Inc., SAP SE, Oracle Corporation, ADP, Inc., UKG Inc., Microsoft Corporation, Dayforce, Inc., Paycom Software, Inc., Paylocity Holding Corporation, Paycor HCM, Inc., Ultimate Kronos Group, Cornerstone OnDemand, Inc., iCIMS, Inc., SmartRecruiters, Inc., Workhuman, Inc., BambooHR, LLC, Rippling, Deel, Inc., Gusto, Inc., Zenefits (TriNet Group, Inc.), HiBob Ltd., Personio SE, Sage Group plc, Infor, Inc., Ramco Systems Ltd., Darwinbox Digital Solutions Pvt. Ltd., Greenhouse Software, Inc., Eightfold AI, Inc., Beamery, Inc., Culture Amp Pty Ltd, Qualtrics International Inc., Alight, Inc., Employment Hero Pty Ltd and Zoho Corporation Pvt. Ltd. are the suppliers covered in Brazil. One line leads on both counts here: Software holds 62% of 2025 revenue and compounds fastest at 9.74%. The commercial size of that position is USD 2.2 billion in 2025 and USD 4.79 billion by 2034, 5.5% of the global total in the base year.
Mexico
2nd-largest in Latin America, growing 2.4×.
- In region 2 of 2
- Of region 25%
- Of global 1.4%
- Revenue $0.55B → $1.30B
Within Latin America, Mexico accounts for 25% of regional revenue and 1.38% of the global total, worth USD 0.55 billion in 2025 and USD 1.3 billion by 2034.
Middle East and Africa Market Analysis
The 5th-largest region covered, holding its share flat through 2034, while revenue still grows 2.2×.
- Rank 5 of 5
- 2025 share 5.5%
- By 2034 5.5%
- Revenue $2.20B → $4.79B
USD 2.2 billion of 2025 revenue is generated in Middle East and Africa, 5.5% of the global human resource technology market with USD 4.79 billion projected for 2034. By revenue it sits fifth across the study, and the ranking does not change between 2025 and 2034.
Share settles at 5.5% in 2034, while nothing contracts here; other regions simply grow faster, which shows up as relative weight, not as falling revenue.
Within the region the component split tracks the global one; 62% of 2025 revenue in Software, fastest growth of 9.74% in Software. Revenue for Middle East and Africa is broken out by every segmentation axis and by country in the full report.
Saudi Arabia
The largest market in Middle East and Africa, growing 2.7×.
- In region 1 of 3
- Of region 20.4%
- Of global 1.1%
- Revenue $0.45B → $1.20B
USD 0.45 billion of Middle East and Africa's 2025 revenue is generated in Saudi Arabia, the region's largest market, reaching USD 1.2 billion by 2034. 20.45% of the region in the base year makes it the largest market here without making it the region. Regional revenue of USD 2.2 billion in 2025 and USD 4.79 billion in 2034 sits around it, and it is the country used wherever the full report cuts a figure by geography.
Demand in Saudi Arabia follows the component mix reported at global level: Software is the largest line at 62% of 2025 revenue, moving to 66.5% by 2034, while Software grows fastest at 9.74% and takes its share from 62% to 66.5%. Because the country carries 20.45% of Middle East and Africa, a movement in its own mix shows up in the regional totals instead of being averaged away by neighbouring markets. Per-component revenue for Saudi Arabia appears on its own in the full report.
In Saudi Arabia, human resource technology intersects with labour administration and data protection. The Ministry of Human Resources and Social Development runs the national platforms for contracts, wage protection and workforce localisation, and payroll or recruitment software must align with them. The Saudi Data and Artificial Intelligence Authority enforces the Personal Data Protection Law, which sets rules on consent, storage and cross-border transfer of employee data. The National Cybersecurity Authority issues controls that apply to cloud services and critical sectors, and the Communications, Space and Technology Commission licenses cloud providers. Suppliers commonly host data in-country to meet these requirements.
Competition in Saudi Arabia runs between the suppliers this study tracks: Workday, Inc., SAP SE, Oracle Corporation, ADP, Inc., UKG Inc., Microsoft Corporation, Dayforce, Inc., Paycom Software, Inc., Paylocity Holding Corporation, Paycor HCM, Inc., Ultimate Kronos Group, Cornerstone OnDemand, Inc., iCIMS, Inc., SmartRecruiters, Inc., Workhuman, Inc., BambooHR, LLC, Rippling, Deel, Inc., Gusto, Inc., Zenefits (TriNet Group, Inc.), HiBob Ltd., Personio SE, Sage Group plc, Infor, Inc., Ramco Systems Ltd., Darwinbox Digital Solutions Pvt. Ltd., Greenhouse Software, Inc., Eightfold AI, Inc., Beamery, Inc., Culture Amp Pty Ltd, Qualtrics International Inc., Alight, Inc., Employment Hero Pty Ltd and Zoho Corporation Pvt. Ltd.. Software is where the volume is, at 62% of 2025 revenue, and it is growing fastest as well at 9.74%. The commercial size of that position is USD 2.2 billion in 2025, moving to USD 4.79 billion by 2034 across the forecast period.
South Africa
2nd-largest in Middle East and Africa, growing 2.0×.
- In region 2 of 3
- Of region 18.2%
- Of global 1%
- Revenue $0.40B → $0.80B
1% of global revenue is generated in South Africa; USD 0.4 billion in 2025, reaching USD 0.8 billion in 2034, and 18.18% of Middle East and Africa.
United Arab Emirates
3rd-largest in Middle East and Africa, growing 2.7×.
- In region 3 of 3
- Of region 15.9%
- Of global 0.9%
- Revenue $0.35B → $0.95B
The United Arab Emirates is sized at USD 0.35 billion in 2025, rising to USD 0.95 billion by 2034; 0.88% of global revenue and 15.91% of Middle East and Africa. It is reported separately from Saudi Arabia across every segmentation axis in the full report.
Download a free sample to see the full data tables and segment-level detail behind this analysis.
Report Coverage
This report assesses the market across every segment, with revenue and a growth rate for each line in each year of the study period. It covers the drivers, trends, opportunities, restraints and challenges shaping growth, the competitive landscape and the companies profiled, and the research methodology behind every estimate. Segmentation is reported by component, solution type, deployment mode, organization size, technology, pricing model, vendor type, workforce type, end-use industry, sales channel, and regional analysis covers North America, Europe, Asia Pacific, Latin America, Middle East and Africa, each broken out by country.
Competitive Landscape
Scale in Software and Growth in Software Set the Terms of Competition
The study covers the following suppliers: Workday, Inc., SAP SE, Oracle Corporation, ADP, Inc., UKG Inc., Microsoft Corporation, Dayforce, Inc., Paycom Software, Inc., Paylocity Holding Corporation, Paycor HCM, Inc., Ultimate Kronos Group, Cornerstone OnDemand, Inc., iCIMS, Inc., SmartRecruiters, Inc., Workhuman, Inc., BambooHR, LLC, Rippling, Deel, Inc., Gusto, Inc., Zenefits (TriNet Group, Inc.), HiBob Ltd., Personio SE, Sage Group plc, Infor, Inc., Ramco Systems Ltd., Darwinbox Digital Solutions Pvt. Ltd., Greenhouse Software, Inc., Eightfold AI, Inc., Beamery, Inc., Culture Amp Pty Ltd, Qualtrics International Inc., Alight, Inc., Employment Hero Pty Ltd and Zoho Corporation Pvt. Ltd..
Where suppliers actually compete is along the component axis. Volume sits in Software, USD 24.8 billion and 62% of 2025 revenue, 66.5% by 2034, which is also where an incumbent is hardest to dislodge. Movement is concentrated in Software; 9.74% growth, against 7.37% at the other end of the axis in Services. Those are different problems, and a supplier strong in one is not thereby strong in the other; that is what sustains a field this size in a USD 40 billion market.
Suppliers separate on breadth of the product suite, the depth of payroll and compliance coverage across countries, and the quality of the data they hold on workforce patterns. The largest players hold advantages in global payroll engines, large installed bases that make switching costly, partner networks for implementation, and the investment capacity to build automation features. Smaller and regional vendors compete on ease of use, fast deployment, pricing for small employers, local statutory knowledge, and focus on one function such as recruiting or engagement. Integration with existing finance and identity systems often decides enterprise selections.
Presence matters unevenly by region. With 38% of 2025 revenue in North America and 27% in Asia Pacific, a supplier's coverage of those two decides most of its addressable base before any product question arises.
Per-company profiles, financials, share and development history are in the full report and not here.
List of Key Human Resource Technology Market Companies Profiled
34 companies profiled. Company profiles, including financials, product portfolios and recent developments, are part of the full report.
- Workday, Inc.(United States)
- SAP SE(Germany)
- Oracle Corporation(United States)
- ADP, Inc.(United States)
- UKG Inc.(United States)
- Microsoft Corporation(United States)
- Dayforce, Inc.(United States)
- Paycom Software, Inc.(United States)
- Paylocity Holding Corporation(United States)
- Paycor HCM, Inc.(United States)
- Ultimate Kronos Group(United States)
- Cornerstone OnDemand, Inc.(United States)
- iCIMS, Inc.(United States)
- SmartRecruiters, Inc.(United States)
- Workhuman, Inc.
- BambooHR, LLC(United States)
- Rippling(United States)
- Deel, Inc.(United States)
- Gusto, Inc.(United States)
- Zenefits (TriNet Group, Inc.)(United States)
- HiBob Ltd.(Israel)
- Personio SE(Germany)
- Sage Group plc(United Kingdom)
- Infor, Inc.(United States)
- Ramco Systems Ltd.(India)
- Darwinbox Digital Solutions Pvt. Ltd.(India)
- Greenhouse Software, Inc.(United States)
- Eightfold AI, Inc.(United States)
- Beamery, Inc.(United Kingdom)
- Culture Amp Pty Ltd(Australia)
- Qualtrics International Inc.(United States)
- Alight, Inc.(United States)
- Employment Hero Pty Ltd(Australia)
- Zoho Corporation Pvt. Ltd.(India)
Geographic Coverage
Every market below is broken out separately in the report.
North America
3Europe
8Asia Pacific
12Latin America
3Middle East and Africa
4Key Insights
Report Scope
Study parameters & segmentationThis study covers market size and forecasts over the 2020–2034 period, segmentation across 10 axes (Component, Solution Type, Deployment Mode, Organization Size, Technology, Pricing Model, Vendor Type, Workforce Type, End-use Industry, Sales Channel), regional analysis for 5 regions and their constituent countries, a competitive landscape profiling 34 key companies, and the research methodology behind every estimate.
Segmentation
10 axes + regionQuestions This Report Answers
6 questionsWhat is the market size and growth rate, globally and by region?
How is the market segmented, and which segments lead?
Which regions and countries are covered, and how do they compare?
What are the key drivers, restraints, opportunities and challenges?
Who are the leading companies operating in this market?
What trends are expected to shape the market through the forecast period?
Frequently Asked Questions
01What is the Human Resource Technology Market projected to reach?
USD 87 USD Billion by 2034, CAGR 8.9%
02What years does this report cover?
Study period 2020–2034, base year 2025, historical data 2020-2024, forecast period 2026-2034.
03Which regions are covered?
North America, Europe, Asia Pacific, Latin America, Middle East and Africa.
04Which region accounted for the largest market share?
North America leads with 38% of global revenue through 2034.
05Which segment leads the market?
Software is the largest line by component, at 62% of revenue in 2025.
06Who are the key companies profiled?
Workday, Inc., SAP SE, Oracle Corporation, ADP, Inc., UKG Inc., Microsoft Corporation, Dayforce, Inc., Paycom Software, Inc., Paylocity Holding Corporation, Paycor HCM, Inc., Ultimate Kronos Group, Cornerstone OnDemand, Inc., iCIMS, Inc., SmartRecruiters, Inc., Workhuman, Inc., BambooHR, LLC, Rippling, Deel, Inc., Gusto, Inc., Zenefits (TriNet Group, Inc.), HiBob Ltd., Personio SE, Sage Group plc, Infor, Inc., Ramco Systems Ltd., Darwinbox Digital Solutions Pvt. Ltd., Greenhouse Software, Inc., Eightfold AI, Inc., Beamery, Inc., Culture Amp Pty Ltd, Qualtrics International Inc., Alight, Inc., Employment Hero Pty Ltd, Zoho Corporation Pvt. Ltd.. Full profiles are part of the paid report.
07Can the segmentation be customized?
Yes. Custom data cuts by geography, segment, or competitor set are available on request.
Why choose CDI
Need this report shaped around your question?
The scope isn't fixed. Tell us what your team needs that the standard edition doesn't cover, and an analyst will come back on what can be adjusted and how long it takes, before you commit to anything.
Most licences include 30–60 hours of customization at no extra cost. See what each licence includes
Additional Companies
Add competitors, suppliers or the peer set you benchmark against to the companies already covered.
Deeper Competitive View
Sharpen the landscape work around your own position: product line, channel, or a named shortlist of rivals.
Extra Segment Splits
Break the market down along an axis the standard scope doesn't cut it by, or go a level deeper inside one.
Application Focus
Narrow the analysis to the specific use cases and end users your team actually sells into.
Different Time Frame
Move the base year, or widen the historical and forecast windows the study is built on.
Country-Level Detail
Go below region level into the individual countries that matter to you, rather than the standard geography split.