
Care Management Solutions MarketSize, Share & Industry Analysis, 2026-2034By ComponentBy Care Management TypeBy Deployment ModeBy End UserBy FunctionalityBy Pricing ModelBy Care SettingBy Patient ConditionBy Organization SizeBy Payment / Reimbursement Model
Full title & scope — all 10 axes with their segments
Care Management Solutions Market Size, Share & Industry Analysis, By Component (Software, Services), By Care Management Type (Case Management, Disease Management, Population Health Management, Wellness Management, Utilization & Medical Management, Remote Patient Monitoring-Enabled Care Management), By Deployment Mode (Cloud-Based, On-Premise, Web-Based), By End User (Healthcare Payers, Healthcare Providers, Employers, Government & Public Health Agencies, Other End Users), By Functionality (Care Coordination, Patient Engagement, Risk Stratification & Analytics, Care Planning & Workflow Automation, Referral & Transition Management, Social Determinants of Health Management), By Pricing Model (Subscription, Per Member Per Month, Perpetual License, Usage / Transaction-Based), By Care Setting (Ambulatory / Outpatient, Inpatient, Home-Based Care, Long-Term & Post-Acute Care, Telehealth / Virtual Care), By Patient Condition (Diabetes, Cardiovascular Diseases, Respiratory Diseases, Cancer, Behavioral & Mental Health, Multiple / Complex Chronic Conditions), By Organization Size (Large Enterprises, Mid-Sized Organizations, Small Practices and Plans), By Payment / Reimbursement Model (Fee-for-Service, Value-Based Care / Accountable Care, Capitation, Bundled Payments), and Regional Forecast, 2026-2034
Market outlook, key takeaways, drivers and challenges for the report period.
- 01By ComponentSoftware · Services
- 02By Care Management TypeCase Management · Disease Management · Population Health Management
- 03By Deployment ModeCloud-Based · On-Premise · Web-Based
- 04By End UserHealthcare Payers · Healthcare Providers · Employers
- 05By FunctionalityCare Coordination · Patient Engagement · Risk Stratification & Analytics
- 06By Pricing ModelSubscription · Per Member Per Month · Perpetual License
- 07By Care SettingAmbulatory / Outpatient · Inpatient · Home-Based Care
- 08By Patient ConditionDiabetes · Cardiovascular Diseases · Respiratory Diseases
- 09By Organization SizeLarge Enterprises · Mid-Sized Organizations · Small Practices and Plans
- 10By Payment / Reimbursement ModelFee-for-Service · Value-Based Care / Accountable Care · Capitation
- 11By Region
Market Analysis & Outlook
Care management solutions are software platforms and supporting services that help organizations coordinate care for people with ongoing or complex health needs. They cover case and disease management, population health, utilization review, wellness programs and remote monitoring-enabled care, delivered through cloud, on-premise or web-based systems and licensed by subscription, per member per month fee, perpetual licence or usage. Buyers include health plans, hospitals and physician groups, employers and government health agencies.
Growth of 10% a year carries the global care management solutions market from USD 19.5 billion in 2025 to USD 46.5 billion in 2034. The full series behind that rate covers USD 12.1 billion in 2020, USD 17.8 billion in 2024, USD 21.7 billion in 2026 and USD 32.5 billion in 2030, with 2025 as the base year.
Composition changes more than the total does. Services, at 11.1%, outgrows Software at 9.3%, and its share moves from 38% to 41.6%. Software stays the largest line throughout, at USD 12.09 billion in 2025 and USD 27.16 billion in 2034. The lines gaining share are Services. Software lose share without losing revenue.
By care management type, Case Management accounts for 24% of 2025 revenue at USD 4.68 billion, reaching USD 8.84 billion and 19% by 2034. Remote Patient Monitoring-Enabled Care Management grows faster at 18.3% against 7.3%, moving from 10% of revenue to 19% by 2034. This axis divides the same revenue as the component split instead of adding to it, so the two are read together and never summed.
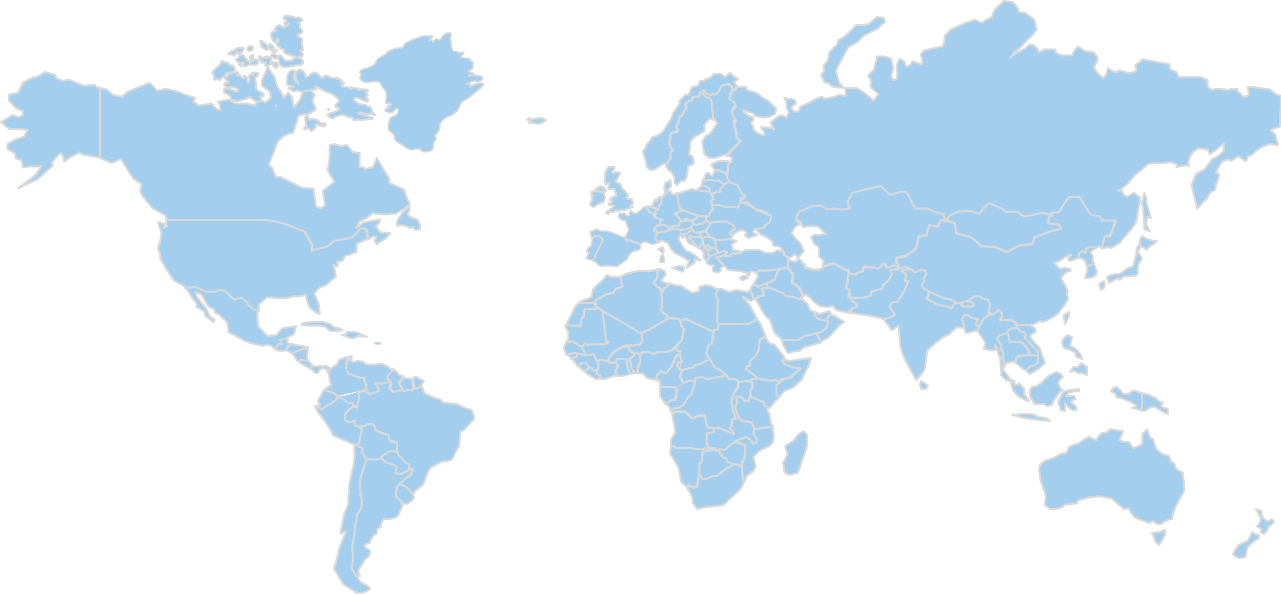
The regional order runs from North America at 40% of 2025 revenue down to Middle East and Africa at 6%. North America is worth USD 7.8 billion in 2025 and USD 16.93 billion in 2034; Europe, second at 25%, moves from USD 4.88 billion to USD 10.79 billion. Share shifts toward Asia Pacific over the forecast period, so the regional split repays a close reading.
The 2025 total is a triangulation of published figures and category proxies, short of a directly sourced total. Segment, regional and country splits are estimated on the same basis, which bounds the precision of the figures above. Coverage runs to five regions, two component lines and ten segmentation axes across a fifteen-year window.
Market Size, 2020–2034
USD BillionRevenue in USD Billion. Values up to 2025 are actuals; 2026–2034 are forecast.
Key Takeaways
- Revenue grows from USD 19.5 billion in 2025 to USD 46.5 billion in 2034, a compound annual rate of 10%, having reached USD 17.8 billion in 2024 from USD 12.1 billion in 2020.
- 62% of 2025 revenue sits in Software (USD 12.09 billion) and it remains the largest component line in 2034 at USD 27.16 billion and 58.4%.
- Fastest growth on the component axis belongs to Services: 11.1% a year, USD 7.41 billion to USD 19.34 billion, and a share moving from 38% to 41.6%.
- Scenario range for 2034 runs from USD 38.9 billion in the bear case to USD 54.2 billion in the bull case, against a base-case USD 46.5 billion, the spread a plan built on this forecast has to absorb.
- The largest region is North America, generating USD 7.8 billion in 2025 (40% of the global total) and USD 16.93 billion by 2034, ahead of Europe at 25%.
- Within North America, the United States is the worked country example, at USD 7 billion in 2025; 89.7% of regional revenue in the base year, and USD 15.1 billion by 2034.
- Every line on all ten segmentation axes and in each of the five regions carries its own revenue, share and growth rate for all fifteen years, 2020 through 2034, on a 2025 base.
Market Trends
Revenue Share, By component
Base year 2025Software leads with 62.0% of component segment revenue.
Share of component segment revenue, most recent base year.
The global care management solutions market is shaped over 2026-2034 by three measurable movements: a change in the component mix, a shift in where revenue sits geographically, and the 10% rate carrying the total.
The direction of the market is not in question in any of the three. Each line and each region grows in revenue terms; what separates them is which takes the larger part of the growth.
Composition shifts on the component axis. 11.1% against 9.3%: that gap, between Services and Software, is the largest on the component axis. Services takes its share of revenue from 38% to 41.6% while Software gives up ground, from 62% to 58.4%. In absolute terms Services rises from USD 7.41 billion to USD 19.34 billion, while Software rises from USD 12.09 billion to USD 27.16 billion. Both grow; the gap is wide enough to reshape the mix inside a single forecast window.
Growth concentrates in Asia Pacific. Asia Pacific moves from 22% of revenue in 2025 to 27.4% in 2034, worth USD 4.29 billion rising to USD 12.74 billion. Against that, North America at 40% moving to 36.4%, Europe at 25% moving to 23.2%, Latin America at 7% moving to 7%, Middle East and Africa at 6% moving to 6%, a fall in share, not in revenue. That makes the regional split worth reading directly instead of scaling from the global rate: the same market rate produces different outcomes depending on where a supplier's revenue sits.
Fifteen years without a discontinuity. Fifteen years of revenue run USD 12.1 billion in 2020, USD 17.8 billion in 2024, USD 19.5 billion in 2025, USD 21.7 billion in 2026, USD 32.5 billion in 2030 and USD 46.5 billion in 2034. There is no discontinuity to time, and 10% forecast growth against 10% historical means the trend continues and does not turn. That moves the planning question away from timing a turn and onto the component and regional mixes, where the actual movement is.
Market Growth Factors
The fastest line decides the blended rate
Market Drivers
3- 01The fastest line decides the blended rate
11.1% growth in Services, against 10% for the market as a whole, moves it from USD 7.41 billion and 38% of revenue in 2025 to USD 19.34 billion and 41.6% in 2034. The market's overall 10% depends on that rate holding: at the 9.3% recorded by Software, the same revenue base would compound to a materially smaller 2034 total. A portfolio weighted away from it tracks below the market even in a market growing everywhere.
- 02The two largest regions hold most of the base
North America is the largest region at USD 7.8 billion in 2025, 40% of global revenue, and reaches USD 16.93 billion by 2034 while holding 36.4%. Europe adds a further 25% at USD 4.88 billion, reaching USD 10.79 billion. Because both the existing revenue and the revenue added concentrate in these two, regional weighting matters more to a forecast than regional count does.
- 03The base has grown every year since 2020
USD 12.1 billion in 2020, USD 17.8 billion in 2024 and USD 19.5 billion in 2025: 10% compound growth before the forecast period even begins. The forecast continues at 10% to USD 46.5 billion in 2034. Because the growth is already in the record and not only in the projection, the rate is held flat across the forecast instead of ramped, and the risk in the number sits in the mix assumptions, not in whether the market grows at all.
Growth drivers
| # | Growth driver | Impact | Gross contribution (USD Billion) | 2026-28 | 2029-31 | 2032-34 |
|---|---|---|---|---|---|---|
| 1 | Shift to value-based and risk-bearing care contracts | High | +8.6 | High | High | Medium |
| 2 | Rising chronic disease burden and ageing populations | High | +7.4 | High | High | Medium |
| 3 | Cloud delivery and AI-enabled risk stratification | Medium-High | +6 | Medium | High | High |
| 4 | Growth of home-based care and remote monitoring | Medium-High | +5 | Medium | High | High |
| 5 | Interoperability and data-sharing mandates | Medium | +2.9 | High | Medium | Low |
| 6 | Others | Low | +1.6 | Low | Low | Low |
| Total | +31.5 | |||||
Restraints
| # | Restraint | Impact | Estimated reduction (USD Billion) | 2026-28 | 2029-31 | 2032-34 |
|---|---|---|---|---|---|---|
| 1 | Integration cost and fragmented health records | Medium-High | −1.9 | High | Medium | Medium |
| 2 | Privacy, security and compliance burden | Medium | −1.4 | Medium | Medium | Medium |
| 3 | Clinical workforce shortages and slow adoption by small practices | Medium | −1.2 | Medium | Medium | Low |
| Total | −4.5 | |||||
Drivers contribute 31.5 USD Billion and restraints remove 4.5 USD Billion, a net 27 USD Billion, which is the revenue the market adds between the base year and 2034. Contributions are CDI estimates, apportioned so that they reconcile with the forecast rather than being read from it.
Separate the 10% into its parts and three show up: an already-large base compounding, the component mix moving toward its faster lines, and regional growth landing unevenly.
Restraining Factors
The bear case and what drives it
Market Restraints
2- 01The bear case and what drives it
A bear case of USD 38.9 billion in 2034, against USD 46.5 billion in the base case, rests on one stated assumption: payment reform stalls, health IT budgets tighten, integration costs stay high and small practices defer purchases, slowing the move away from on-premise systems. Neither case changes the USD 19.5 billion 2025 base.
- 02Software holds the blended rate down
With 62% of 2025 revenue (USD 12.09 billion) Software is where most of the market sits, and it grows at only 9.3% against the market's 10%. Revenue still reaches USD 27.16 billion by 2034 and share still falls to 58.4%: a drag on the average, not a decline.
Market Opportunities
What the bull case turns on
Market Opportunities
2- 01What the bull case turns on
A bull case of USD 54.2 billion by 2034, against USD 46.5 billion in the base case, turns on a single stated assumption: value-based and risk-bearing contracts spread faster, cloud migration completes earlier, and wider reimbursement for remote monitoring lifts adoption among mid-sized and small organizations. The USD 19.5 billion 2025 base is common to both.
- 02Services is where share changes hands
Services grows at 11.1% against 10% for the market, adding revenue from USD 7.41 billion in 2025 to USD 19.34 billion in 2034 and taking its share from 38% to 41.6%. It is the place on this axis where share changes hands at scale, so it is where an entrant can take position without displacing the incumbent in Software.
Market Challenges
The total depends on a single line
Market Challenges
2- 01The total depends on a single line
USD 12.09 billion of 2025 revenue sits in Software, 62% of the total, and it is still 58.4% at USD 27.16 billion nine years later. That concentration means the market's own forecast is, to a large extent, a forecast for one component line.
- 02One country drives the leading region
The United States generates USD 7 billion of North America's USD 7.8 billion in 2025, 89.7% of the region, reaching USD 15.1 billion by 2034. The consequence is that regional risk here is really country risk wearing a larger label.
Segmentation Analysis
10 axesten segmentation axes are reported; by component, by care management type, deployment mode, end user, functionality, pricing model, care setting, patient condition, organization size and payment / reimbursement model. Every one of them divides the same revenue, which makes them views of one market from different commercial angles, not components of it.
Two component lines are reported. One of them takes share over the forecast period and the other gives it up, though every line grows in absolute terms between 2025 and 2034.
By Component · 2 segments
Software Led by Component in 2025, with Services Growing Fastest
- Largest Software · 62%
- Fastest Services · 11.1%
- Moves most Software · -3.6 pts
- Order by 2034 unchanged
| Segment | 2025 | Share | 2034 | Share | CAGR |
|---|---|---|---|---|---|
| Software | $12.09B | 62% | $27.16B | 58.4%-3.6 | 9.3% |
| Services | $7.41B | 38% | $19.34B | 41.6%+3.6 | 11.1% |
Software leads because the licence or subscription for the platform is the core purchase and the base on which every care program runs. Services grow faster as buyers need integration with existing records, configuration of workflows and ongoing outreach support, and as more organizations choose managed or outsourced care coordination instead of staffing it internally. The fastest line is Services, which is why the split shifts toward it over the period. By 2034 Software is still ahead, making this a shift in weight, not a change of leader. This is the axis the estimation prices in full, year by year, and the one the regional chapters cut against.
By Care Management Type · 6 segments
Case Management Led by Care management type in 2025, with Remote Patient Monitoring-Enabled Care Management Growing Fastest
- Largest Case Management · 24%
- Fastest Remote Patient Monitoring-Enabled Care Management · 18.3%
- Moves most Remote Patient Monitoring-Enabled Care Management · +9 pts
- Order by 2034 changes
| Segment | 2025 | Share | 2034 | Share | CAGR |
|---|---|---|---|---|---|
| Case Management | $4.68B | 24% | $8.84B | 19%-5 | 7.3% |
| Disease Management | $3.90B | 20% | $7.44B | 16%-4 | 7.4% |
| Population Health Management | $4.29B | 22% | $11.62B | 25%+3 | 11.7% |
| Wellness Management | $1.56B | 8% | $3.25B | 7%-1 | 8.5% |
| Utilization & Medical Management | $3.12B | 16% | $6.51B | 14%-2 | 8.5% |
| Remote Patient Monitoring-Enabled Care Management | $1.95B | 10% | $8.84B | 19%+9 | 18.3% |
Case management leads at the outset because it is the longest established discipline and sits inside nearly every payer and provider program. Remote patient monitoring-enabled care grows fastest as reimbursement for connected devices spreads, and population health management moves ahead of case management as risk-bearing contracts require tracking of whole member groups. Leadership changes hands: Population Health Management is the largest line by 2034, not Case Management.
By Deployment Mode · 3 segments
Cloud-Based Holds the Largest Deployment mode Share and Is Still the Quickest to Grow
- Largest Cloud-Based · 58%
- Fastest Cloud-Based · 12.5%
- Moves most Cloud-Based · +12 pts
- Order by 2034 unchanged
| Segment | 2025 | Share | 2034 | Share | CAGR |
|---|---|---|---|---|---|
| Cloud-Based | $11.31B | 58% | $32.55B | 70%+12 | 12.5% |
| On-Premise | $5.85B | 30% | $8.37B | 18%-12 | 4.1% |
| Web-Based | $2.34B | 12% | $5.58B | 12% | 10.1% |
Cloud-based delivery leads because it removes server maintenance, shortens implementation and lets vendors push analytics updates to every customer at once. It also grows fastest as on-premise systems reach renewal and buyers prefer operating expense budgets. Web-based access holds a steady niche among smaller organizations that want a lightweight tool without a full platform rollout. By 2034 Cloud-Based is still ahead, making this a shift in weight, not a change of leader.
By End User · 5 segments
Government & Public Health Agencies Outpaces the Axis While Healthcare Payers Holds the Largest Share
- Largest Healthcare Payers · 38%
- Fastest Government & Public Health Agencies · 11.5%
- Moves most Healthcare Payers · -3 pts
- Order by 2034 changes
| Segment | 2025 | Share | 2034 | Share | CAGR |
|---|---|---|---|---|---|
| Healthcare Payers | $7.41B | 38% | $16.28B | 35%-3 | 9.1% |
| Healthcare Providers | $7.02B | 36% | $17.67B | 38%+2 | 10.8% |
| Employers | $1.95B | 10% | $4.65B | 10% | 10.1% |
| Government & Public Health Agencies | $1.75B | 9% | $4.65B | 10%+1 | 11.5% |
| Other End Users | $1.37B | 7% | $3.25B | 7% | 10.1% |
Healthcare payers lead because they carry the financial risk for member outcomes and run care management at scale across large populations. Government and public health agencies grow fastest as public programs for chronic and complex patients expand and agencies digitise case files, while providers gain as accountable care arrangements move coordination work into hospitals and physician groups. Leadership changes hands: Healthcare Providers is the largest line by 2034, not Healthcare Payers.
By Functionality · 6 segments
Care Coordination Held the Dominant Share of the Functionality Segment in 2025
- Largest Care Coordination · 26%
- Fastest Social Determinants of Health Management · 15.2%
- Moves most Care Coordination · -4 pts
- Order by 2034 changes
| Segment | 2025 | Share | 2034 | Share | CAGR |
|---|---|---|---|---|---|
| Care Coordination | $5.07B | 26% | $10.23B | 22%-4 | 8.1% |
| Patient Engagement | $3.51B | 18% | $8.84B | 19%+1 | 10.8% |
| Risk Stratification & Analytics | $4.29B | 22% | $11.16B | 24%+2 | 11.2% |
| Care Planning & Workflow Automation | $3.12B | 16% | $6.51B | 14%-2 | 8.5% |
| Referral & Transition Management | $1.95B | 10% | $4.18B | 9%-1 | 8.8% |
| Social Determinants of Health Management | $1.56B | 8% | $5.58B | 12%+4 | 15.2% |
Care coordination leads because it is the everyday workflow every other function depends on, from task assignment to shared care plans. Social determinants of health management grows fastest as payers and providers are asked to screen for and act on housing, food and transport needs, and risk stratification gains as analytics decide where outreach staff spend their time. By 2034 the largest line is Risk Stratification & Analytics and no longer Care Coordination, the one axis here where the order actually changes.
By Pricing Model · 4 segments
Subscription Led by Pricing model in 2025, with Usage / Transaction-Based Growing Fastest
- Largest Subscription · 40%
- Fastest Usage / Transaction-Based · 12.4%
- Moves most Perpetual License · -10 pts
- Order by 2034 unchanged
| Segment | 2025 | Share | 2034 | Share | CAGR |
|---|---|---|---|---|---|
| Subscription | $7.80B | 40% | $21.39B | 46%+6 | 11.9% |
| Per Member Per Month | $5.46B | 28% | $13.95B | 30%+2 | 11% |
| Perpetual License | $4.29B | 22% | $5.58B | 12%-10 | 3% |
| Usage / Transaction-Based | $1.95B | 10% | $5.58B | 12%+2 | 12.4% |
Subscription pricing leads and gains share because cloud buyers favour predictable operating costs and vendors favour recurring revenue. Usage and transaction-based models grow fastest from a small base as buyers seek to pay only for the programs and members actually served, while perpetual licences decline as customers move away from large upfront purchases. The order does not change: Subscription is still largest in 2034, and what moves is how much it holds.
By Care Setting · 5 segments
Ambulatory / Outpatient Led by Care setting in 2025, with Home-Based Care Growing Fastest
- Largest Ambulatory / Outpatient · 30%
- Fastest Home-Based Care · 13.2%
- Moves most Inpatient · -6 pts
- Order by 2034 changes
| Segment | 2025 | Share | 2034 | Share | CAGR |
|---|---|---|---|---|---|
| Ambulatory / Outpatient | $5.85B | 30% | $13.02B | 28%-2 | 9.3% |
| Inpatient | $4.68B | 24% | $8.37B | 18%-6 | 6.7% |
| Home-Based Care | $3.51B | 18% | $10.70B | 23%+5 | 13.2% |
| Long-Term & Post-Acute Care | $2.73B | 14% | $6.51B | 14% | 10.1% |
| Telehealth / Virtual Care | $2.73B | 14% | $7.90B | 17%+3 | 12.5% |
Ambulatory and outpatient settings lead because most chronic condition management and follow-up happens outside the hospital. Home-based care grows fastest as payers favour lower-cost sites, ageing patients prefer to stay at home and connected devices make monitoring practical there, with telehealth and virtual care close behind for the same reasons. The order does not change: Ambulatory / Outpatient is still largest in 2034, and what moves is how much it holds.
By Patient Condition · 6 segments
Behavioral & Mental Health Outpaces the Axis While Multiple / Complex Chronic Conditions Holds the Largest Share
- Largest Multiple / Complex Chronic Conditions · 26%
- Fastest Behavioral & Mental Health · 12.5%
- Moves most Behavioral & Mental Health · +3 pts
- Order by 2034 changes
| Segment | 2025 | Share | 2034 | Share | CAGR |
|---|---|---|---|---|---|
| Diabetes | $3.51B | 18% | $7.89B | 17%-1 | 9.4% |
| Cardiovascular Diseases | $3.90B | 20% | $8.37B | 18%-2 | 8.9% |
| Respiratory Diseases | $2.34B | 12% | $5.12B | 11%-1 | 9.1% |
| Cancer | $1.95B | 10% | $5.12B | 11%+1 | 11.3% |
| Behavioral & Mental Health | $2.73B | 14% | $7.91B | 17%+3 | 12.5% |
| Multiple / Complex Chronic Conditions | $5.07B | 26% | $12.09B | 26% | 10.1% |
Multiple and complex chronic conditions lead because the highest-cost patients usually carry several diagnoses at once and are the main target of care programs. Behavioral and mental health grows fastest as integration of mental health into primary care becomes standard and payers seek better coordination for a historically underserved group. The order does not change: Multiple / Complex Chronic Conditions is still largest in 2034, and what moves is how much it holds.
By Organization Size · 3 segments
Large Enterprises Led by Organization size in 2025, with Small Practices and Plans Growing Fastest
- Largest Large Enterprises · 55%
- Fastest Small Practices and Plans · 12.4%
- Moves most Large Enterprises · -5 pts
- Order by 2034 unchanged
| Segment | 2025 | Share | 2034 | Share | CAGR |
|---|---|---|---|---|---|
| Large Enterprises | $10.73B | 55% | $23.25B | 50%-5 | 9% |
| Mid-Sized Organizations | $5.85B | 30% | $14.88B | 32%+2 | 10.9% |
| Small Practices and Plans | $2.92B | 15% | $8.37B | 18%+3 | 12.4% |
Large enterprises lead because big payers and health systems manage the largest populations and can fund multi-module platforms and integration work. Small practices and plans grow fastest as packaged, cloud-delivered tools lower the entry cost and as value-based contracts reach smaller organizations that previously had no formal care management capability. By 2034 Large Enterprises is still ahead, making this a shift in weight, not a change of leader.
By Payment / Reimbursement Model · 4 segments
Value-Based Care / Accountable Care Both Leads the Payment / reimbursement model Axis and Grows Fastest on It
- Largest Value-Based Care / Accountable Care · 40%
- Fastest Value-Based Care / Accountable Care · 12.4%
- Moves most Fee-for-Service · -10 pts
- Order by 2034 unchanged
| Segment | 2025 | Share | 2034 | Share | CAGR |
|---|---|---|---|---|---|
| Fee-for-Service | $5.85B | 30% | $9.30B | 20%-10 | 5.3% |
| Value-Based Care / Accountable Care | $7.80B | 40% | $22.32B | 48%+8 | 12.4% |
| Capitation | $3.51B | 18% | $9.30B | 20%+2 | 11.4% |
| Bundled Payments | $2.34B | 12% | $5.58B | 12% | 10.1% |
Value-based care and accountable care arrangements lead because they pay for outcomes and so reward organizations that coordinate care, making a care management platform close to a requirement. They also grow fastest as these contracts spread from Medicare into commercial and Medicaid programs, while fee-for-service shrinks in relative importance. By 2034 Value-Based Care / Accountable Care is still ahead, making this a shift in weight, not a change of leader.
Regional Insights
Regional Revenue Share
Base year 2025Share of global revenue in the base year.
Only the leading region's share is published outside the report; pins mark the region, not a specific country.
North America Market Analysis
The largest region covered — 3.6 points of share move elsewhere by 2034, while revenue still grows 2.2×.
- Rank 1 of 5
- 2025 share 40%
- By 2034 36.4%
- Revenue $7.80B → $16.93B
In North America, 40% of global revenue puts 2025 at USD 7.8 billion and reaches USD 16.93 billion by 2034. Among the five regions it ranks first by revenue in both years.
36.4% of global revenue sits here in 2034, below the 2025 level, while nothing contracts here; other regions simply grow faster, which shows up as relative weight, not as falling revenue.
The component mix reported at global level applies here, with Software the largest line at 62% of 2025 revenue and Services the fastest-growing at 11.1%. The full report breaks North America out along every axis and by country.
United States
Sets the pace for North America at 89.7% of it, growing 2.2×.
- In region 1 of 2
- Of region 89.7%
- Of global 35.9%
- Revenue $7B → $15.10B
The largest single market in North America is the United States, at USD 7 billion in 2025 and USD 15.1 billion in 2034. Because it is 89.7% of the region in the base year, North America's totals move with this one country instead of a spread of them. Against regional totals of USD 7.8 billion in 2025 and USD 16.93 billion in 2034, it is the country the full report breaks out in detail.
the United States buys along the same lines as the market globally; Software first at 62% of 2025 revenue and 58.4% in 2034, Services fastest at 11.1% on a share moving from 38% to 41.6%. Its 89.7% weight in North America means those movements carry straight into the regional totals. Revenue by component for the United States is reported separately in the full report.
Care management software in the United States is regulated mainly through the Department of Health and Human Services. The Health Insurance Portability and Accountability Act sets privacy and security duties for suppliers acting as business associates of providers and payers. The Office of the National Coordinator for Health IT runs the health IT certification program and the information blocking rules, which affect how platforms exchange data. The Food and Drug Administration oversees only those modules that meet the definition of medical device software, such as clinical decision support that falls outside its exemptions. Suppliers also align with Centers for Medicare and Medicaid Services reimbursement rules for chronic care and transitional care programs, and with state privacy laws.
Epic Systems Corporation, Oracle Corporation (Oracle Health), Innovaccer Inc., Salesforce, Inc., Optum, Inc., Cotiviti, Inc., Health Catalyst, Inc., Arcadia.io, Inc., ZeOmega, Inc., Cedar Gate Technologies, Inc., HealthEC, LLC, Azara Healthcare, LLC, Medecision, Inc., Wellframe, Inc., Pega Systems Inc., Philips Healthcare (Koninklijke Philips N.V.), Allscripts / Veradigm Inc., athenahealth, Inc., NextGen Healthcare, Inc., eClinicalWorks, LLC, Evolent Health, Inc., Altruista Health, Inc., Casenet, LLC (Cotiviti), TCS Healthcare Technologies, Welltok, Inc. (Virgin Pulse), Persivia, Inc., Lightbeam Health Solutions, Inc. and MEDITECH (Medical Information Technology, Inc.) are the suppliers covered in the United States. The commercially relevant division is 62% of 2025 revenue in Software, where the volume is, against 11.1% growth in Services, where share moves. Country-level positioning and shares for each of these companies are part of the full report, not of this summary.
Canada
2nd-largest in North America, growing 2.3×.
- In region 2 of 2
- Of region 9%
- Of global 3.6%
- Revenue $0.70B → $1.60B
Canada is sized at USD 0.7 billion in 2025, rising to USD 1.6 billion by 2034; 3.6% of global revenue and 9% of North America. It is reported separately from the United States across every segmentation axis in the full report.
Europe Market Analysis
The 2nd-largest region covered — 1.8 points of share move elsewhere by 2034, while revenue still grows 2.2×.
- Rank 2 of 5
- 2025 share 25%
- By 2034 23.2%
- Revenue $4.88B → $10.79B
USD 4.88 billion of 2025 revenue is generated in Europe, 25% of the global care management solutions market rising to USD 10.79 billion in 2034. That makes it the second-largest region covered, in 2025 and again in 2034.
23.2% of global revenue sits here in 2034, below the 2025 level, while nothing contracts here; other regions simply grow faster, which shows up as relative weight, not as falling revenue.
The component mix reported at global level applies here, with Software the largest line at 62% of 2025 revenue and Services the fastest-growing at 11.1%. Europe is reported axis by axis and country by country in the full study.
Germany
The largest market in Europe, growing 2.3×.
- In region 1 of 3
- Of region 21.5%
- Of global 5.4%
- Revenue $1.05B → $2.40B
Germany is the largest market within Europe, generating USD 1.05 billion in 2025 and projected to reach USD 2.4 billion by 2034. Its 21.5% of base-year regional revenue leads the region, though enough sits elsewhere that Europe is not a proxy for it. Against regional totals of USD 4.88 billion in 2025 and USD 10.79 billion in 2034, it is the country the full report breaks out in detail.
Germany buys along the same lines as the market globally; Software first at 62% of 2025 revenue and 58.4% in 2034, Services fastest at 11.1% on a share moving from 38% to 41.6%. With 21.5% of Europe concentrated here, a change in this country's mix is visible in the regional figures instead of being diluted by its neighbours. Germany carries its own component breakdown in the full report.
In Germany, care management solutions sit under the General Data Protection Regulation and the national Federal Data Protection Act, with health data treated as a special category requiring a clear legal basis and strong safeguards. Software with a medical purpose falls under the EU Medical Device Regulation and must carry CE marking after conformity assessment, with a notified body involved for higher risk classes. The Federal Institute for Drugs and Medical Devices administers the review of digital health applications for statutory reimbursement. Connection to the national telematics infrastructure is supervised by the gematik agency, which sets interoperability and security specifications. Suppliers must also meet hospital and insurer procurement requirements on information security.
The suppliers tracked in this study (Epic Systems Corporation, Oracle Corporation (Oracle Health), Innovaccer Inc., Salesforce, Inc., Optum, Inc., Cotiviti, Inc., Health Catalyst, Inc., Arcadia.io, Inc., ZeOmega, Inc., Cedar Gate Technologies, Inc., HealthEC, LLC, Azara Healthcare, LLC, Medecision, Inc., Wellframe, Inc., Pega Systems Inc., Philips Healthcare (Koninklijke Philips N.V.), Allscripts / Veradigm Inc., athenahealth, Inc., NextGen Healthcare, Inc., eClinicalWorks, LLC, Evolent Health, Inc., Altruista Health, Inc., Casenet, LLC (Cotiviti), TCS Healthcare Technologies, Welltok, Inc. (Virgin Pulse), Persivia, Inc., Lightbeam Health Solutions, Inc. and MEDITECH (Medical Information Technology, Inc.)) compete in Germany across the component lines above. Software, at 62% of 2025 revenue, is where the volume sits, and Services, growing at 11.1%, is where position changes hands over the forecast period. A supplier weighted toward Europe is competing over a base of USD 4.88 billion in 2025, reaching USD 10.79 billion by 2034 on the trajectory this study models.
United Kingdom
2nd-largest in Europe, growing 2.3×.
- In region 2 of 3
- Of region 19.5%
- Of global 4.9%
- Revenue $0.95B → $2.15B
The United Kingdom is sized at USD 0.95 billion in 2025, rising to USD 2.15 billion by 2034; 4.9% of global revenue and 19.5% of Europe. It is reported separately from Germany across every segmentation axis in the full report.
France
3rd-largest in Europe, growing 2.3×.
- In region 3 of 3
- Of region 12.7%
- Of global 3.2%
- Revenue $0.62B → $1.40B
Within Europe, France accounts for 12.7% of regional revenue and 3.2% of the global total, worth USD 0.62 billion in 2025 and USD 1.4 billion by 2034.
Asia Pacific Market Analysis
The 3rd-largest region covered, and the one gaining the most — it picks up 5.4 points of share by 2034, while revenue still grows 3.0×.
- Rank 3 of 5
- 2025 share 22%
- By 2034 27.4%
- Revenue $4.29B → $12.74B
USD 4.29 billion of 2025 revenue is generated in Asia Pacific, 22% of the global care management solutions market with USD 12.74 billion projected for 2034. Among the five regions it ranks third by revenue in both years.
Its share rises to 27.4% over the forecast period, so the region grows faster than the market's 10% and takes a larger part of the revenue added by 2034 than its 2025 weight implies.
Within the region the component split tracks the global one; 62% of 2025 revenue in Software, fastest growth of 11.1% in Services. The full report breaks Asia Pacific out along every axis and by country.
China
The largest market in Asia Pacific, growing 3.4×.
- In region 1 of 3
- Of region 29.1%
- Of global 6.4%
- Revenue $1.25B → $4.20B
The largest single market in Asia Pacific is China, at USD 1.25 billion in 2025 and USD 4.2 billion in 2034. At 29.1% of the region in 2025 it leads, but a majority of Asia Pacific's revenue is generated in other markets. Set against USD 4.29 billion and USD 12.74 billion for the region, it is why this market, and not a smaller one, is the one reported in full.
Demand in China follows the component mix reported at global level: Software is the largest line at 62% of 2025 revenue, moving to 58.4% by 2034, while Services grows fastest at 11.1% and takes its share from 38% to 41.6%. Since 29.1% of Asia Pacific's revenue is generated here, the regional numbers inherit this market's mix instead of smoothing it out. Per-component revenue for China appears on its own in the full report.
Care management platforms in China are governed by several overlapping frameworks. The National Medical Products Administration classifies and registers software that performs a medical function as a medical device, and the route depends on its risk class. The National Health Commission sets rules for internet hospitals, electronic medical records and the management of health information. Data handling falls under the Cybersecurity Law, the Data Security Law and the Personal Information Protection Law, which impose consent, classification and cross-border transfer controls. Health data stored by foreign suppliers generally has to remain onshore unless a security assessment is passed. Hospital deployments often also require compliance with national standards for electronic record grading and interoperability.
Competition in China runs between the suppliers this study tracks: Epic Systems Corporation, Oracle Corporation (Oracle Health), Innovaccer Inc., Salesforce, Inc., Optum, Inc., Cotiviti, Inc., Health Catalyst, Inc., Arcadia.io, Inc., ZeOmega, Inc., Cedar Gate Technologies, Inc., HealthEC, LLC, Azara Healthcare, LLC, Medecision, Inc., Wellframe, Inc., Pega Systems Inc., Philips Healthcare (Koninklijke Philips N.V.), Allscripts / Veradigm Inc., athenahealth, Inc., NextGen Healthcare, Inc., eClinicalWorks, LLC, Evolent Health, Inc., Altruista Health, Inc., Casenet, LLC (Cotiviti), TCS Healthcare Technologies, Welltok, Inc. (Virgin Pulse), Persivia, Inc., Lightbeam Health Solutions, Inc. and MEDITECH (Medical Information Technology, Inc.). Volume sits in Software at 62% of 2025 revenue; movement sits in Services at 11.1% growth. A supplier weighted toward Asia Pacific is competing over a base of USD 4.29 billion in 2025 reaching USD 12.74 billion by 2034, 22% of global revenue at the start of that period.
Japan
2nd-largest in Asia Pacific, growing 2.6×.
- In region 2 of 3
- Of region 22.1%
- Of global 4.9%
- Revenue $0.95B → $2.50B
Within Asia Pacific, Japan accounts for 22.1% of regional revenue and 4.9% of the global total, worth USD 0.95 billion in 2025 and USD 2.5 billion by 2034.
India
3rd-largest in Asia Pacific, growing 4.5×.
- In region 3 of 3
- Of region 9.3%
- Of global 2.1%
- Revenue $0.40B → $1.80B
2.1% of global revenue is generated in India; USD 0.4 billion in 2025, reaching USD 1.8 billion in 2034, and 9.3% of Asia Pacific.
Latin America Market Analysis
The 4th-largest region covered, holding its share flat through 2034, while revenue still grows 2.4×.
- Rank 4 of 5
- 2025 share 7%
- By 2034 7%
- Revenue $1.37B → $3.26B
Latin America holds 7% of the global care management solutions market in 2025, worth USD 1.37 billion with USD 3.26 billion projected for 2034. It is a marginal region on this axis, fourth by revenue throughout the period.
7% of global revenue sits here in 2034, below the 2025 level, while nothing contracts here; other regions simply grow faster, which shows up as relative weight, not as falling revenue.
The component mix reported at global level applies here, with Software the largest line at 62% of 2025 revenue and Services the fastest-growing at 11.1%. Latin America is reported axis by axis and country by country in the full study.
Brazil
The largest market in Latin America, growing 2.5×.
- In region 1 of 2
- Of region 40.1%
- Of global 2.8%
- Revenue $0.55B → $1.35B
USD 0.55 billion of Latin America's 2025 revenue is generated in Brazil, the region's largest market, reaching USD 1.35 billion by 2034. 40.1% of the region in the base year makes it the largest market here without making it the region. The region itself runs USD 1.37 billion to USD 3.26 billion over the same period, and this is the market carrying the country-level detail in the full report.
Composition here matches the global split: the largest line is Software at 62% of 2025 revenue, easing to 58.4% by 2034, and the fastest is Services at 11.1%, from 38% to 41.6%. Its 40.1% weight in Latin America means those movements carry straight into the regional totals. Revenue by component for Brazil is reported separately in the full report.
In Brazil, the National Health Surveillance Agency, known as Anvisa, regulates software that qualifies as a medical device, applying a risk-based classification and requiring registration or notification before sale. Care management tools that only handle administrative or coordination tasks usually fall outside that route. Personal health data is covered by the General Data Protection Law, enforced by the National Data Protection Authority, which requires a lawful basis, security measures and incident reporting. The Federal Council of Medicine issues rules on telemedicine and electronic records that shape how clinicians use such platforms. Private payers are supervised by the National Supplementary Health Agency, whose data exchange standards affect suppliers serving health plans.
The suppliers tracked in this study (Epic Systems Corporation, Oracle Corporation (Oracle Health), Innovaccer Inc., Salesforce, Inc., Optum, Inc., Cotiviti, Inc., Health Catalyst, Inc., Arcadia.io, Inc., ZeOmega, Inc., Cedar Gate Technologies, Inc., HealthEC, LLC, Azara Healthcare, LLC, Medecision, Inc., Wellframe, Inc., Pega Systems Inc., Philips Healthcare (Koninklijke Philips N.V.), Allscripts / Veradigm Inc., athenahealth, Inc., NextGen Healthcare, Inc., eClinicalWorks, LLC, Evolent Health, Inc., Altruista Health, Inc., Casenet, LLC (Cotiviti), TCS Healthcare Technologies, Welltok, Inc. (Virgin Pulse), Persivia, Inc., Lightbeam Health Solutions, Inc. and MEDITECH (Medical Information Technology, Inc.)) compete in Brazil across the component lines above. The commercially relevant division is 62% of 2025 revenue in Software, where the volume is, against 11.1% growth in Services, where share moves. A supplier weighted toward Latin America is competing over a base of USD 1.37 billion in 2025, reaching USD 3.26 billion by 2034 on the trajectory this study models.
Mexico
2nd-largest in Latin America, growing 2.5×.
- In region 2 of 2
- Of region 21.9%
- Of global 1.5%
- Revenue $0.30B → $0.75B
Within Latin America, Mexico accounts for 21.9% of regional revenue and 1.5% of the global total, worth USD 0.3 billion in 2025 and USD 0.75 billion by 2034.
Middle East and Africa Market Analysis
The 5th-largest region covered, holding its share flat through 2034, while revenue still grows 2.4×.
- Rank 5 of 5
- 2025 share 6%
- By 2034 6%
- Revenue $1.17B → $2.79B
In Middle East and Africa, 6% of global revenue puts 2025 at USD 1.17 billion rising to USD 2.79 billion in 2034. That makes it the fifth-largest region covered, in 2025 and again in 2034.
By 2034 the share stands at 6%, a shift in share, not in direction: revenue climbs every year while the market's centre of gravity moves elsewhere.
Within the region the component split tracks the global one; 62% of 2025 revenue in Software, fastest growth of 11.1% in Services. Middle East and Africa is reported axis by axis and country by country in the full study.
Saudi Arabia
The largest market in Middle East and Africa, growing 2.8×.
- In region 1 of 3
- Of region 21.4%
- Of global 1.3%
- Revenue $0.25B → $0.70B
The largest single market in Middle East and Africa is Saudi Arabia, at USD 0.25 billion in 2025 and USD 0.7 billion in 2034. Its 21.4% of base-year regional revenue leads the region, though enough sits elsewhere that Middle East and Africa is not a proxy for it. Set against USD 1.17 billion and USD 2.79 billion for the region, it is why this market, and not a smaller one, is the one reported in full.
The component pattern in Saudi Arabia is the global one: 62% of 2025 revenue in Software, 58.4% by 2034, against 11.1% growth in Services taking it from 38% to 41.6%. Its 21.4% weight in Middle East and Africa means those movements carry straight into the regional totals. Per-component revenue for Saudi Arabia appears on its own in the full report.
In Saudi Arabia, the Saudi Food and Drug Authority regulates software that meets the definition of a medical device and requires marketing authorization, an authorized local representative and conformity with its device requirements. The Ministry of Health sets digital health policy and operates national platforms with which provider systems are expected to integrate. The Saudi Data and Artificial Intelligence Authority administers the Personal Data Protection Law, which governs consent, processing and transfer of health data outside the Kingdom. The National Cybersecurity Authority issues controls that apply to healthcare organizations and their technology suppliers. The Council of Health Insurance adds requirements for data exchange with insurers.
In Saudi Arabia the field is Epic Systems Corporation, Oracle Corporation (Oracle Health), Innovaccer Inc., Salesforce, Inc., Optum, Inc., Cotiviti, Inc., Health Catalyst, Inc., Arcadia.io, Inc., ZeOmega, Inc., Cedar Gate Technologies, Inc., HealthEC, LLC, Azara Healthcare, LLC, Medecision, Inc., Wellframe, Inc., Pega Systems Inc., Philips Healthcare (Koninklijke Philips N.V.), Allscripts / Veradigm Inc., athenahealth, Inc., NextGen Healthcare, Inc., eClinicalWorks, LLC, Evolent Health, Inc., Altruista Health, Inc., Casenet, LLC (Cotiviti), TCS Healthcare Technologies, Welltok, Inc. (Virgin Pulse), Persivia, Inc., Lightbeam Health Solutions, Inc. and MEDITECH (Medical Information Technology, Inc.). Software, at 62% of 2025 revenue, is where the volume sits, and Services, growing at 11.1%, is where position changes hands over the forecast period. The commercial size of that position is USD 1.17 billion in 2025, moving to USD 2.79 billion by 2034 across the forecast period.
United Arab Emirates
2nd-largest in Middle East and Africa, growing 2.9×.
- In region 2 of 3
- Of region 14.5%
- Of global 0.9%
- Revenue $0.17B → $0.50B
0.9% of global revenue is generated in the United Arab Emirates; USD 0.17 billion in 2025, reaching USD 0.5 billion in 2034, and 14.5% of Middle East and Africa.
South Africa
3rd-largest in Middle East and Africa, growing 2.5×.
- In region 3 of 3
- Of region 12.8%
- Of global 0.8%
- Revenue $0.15B → $0.38B
South Africa is sized at USD 0.15 billion in 2025, rising to USD 0.38 billion by 2034; 0.8% of global revenue and 12.8% of Middle East and Africa. It is reported separately from Saudi Arabia across every segmentation axis in the full report.
Download a free sample to see the full data tables and segment-level detail behind this analysis.
Report Coverage
This report assesses the market across every segment, with revenue and a growth rate for each line in each year of the study period. It covers the drivers, trends, opportunities, restraints and challenges shaping growth, the competitive landscape and the companies profiled, and the research methodology behind every estimate. Segmentation is reported by component, care management type, deployment mode, end user, functionality, pricing model, care setting, patient condition, organization size, payment / reimbursement model, and regional analysis covers North America, Europe, Asia Pacific, Latin America, Middle East and Africa, each broken out by country.
Competitive Landscape
Position on the Component Axis Decides Competitive Standing
The suppliers covered are: Epic Systems Corporation, Oracle Corporation (Oracle Health), Innovaccer Inc., Salesforce, Inc., Optum, Inc., Cotiviti, Inc., Health Catalyst, Inc., Arcadia.io, Inc., ZeOmega, Inc., Cedar Gate Technologies, Inc., HealthEC, LLC, Azara Healthcare, LLC, Medecision, Inc., Wellframe, Inc., Pega Systems Inc., Philips Healthcare (Koninklijke Philips N.V.), Allscripts / Veradigm Inc., athenahealth, Inc., NextGen Healthcare, Inc., eClinicalWorks, LLC, Evolent Health, Inc., Altruista Health, Inc., Casenet, LLC (Cotiviti), TCS Healthcare Technologies, Welltok, Inc. (Virgin Pulse), Persivia, Inc., Lightbeam Health Solutions, Inc. and MEDITECH (Medical Information Technology, Inc.).
The component axis, not the regional one, is where competition happens. Volume sits in Software, USD 12.09 billion and 62% of 2025 revenue, 58.4% by 2034, which is also where an incumbent is hardest to dislodge. The line that changes hands is Services at 11.1%, well ahead of Software at 9.3%. Those are different problems, and a supplier strong in one is not thereby strong in the other; that is what sustains a field this size in a USD 19.5 billion market.
Suppliers separate on how deeply their platform connects to the electronic health record and claims feeds that care teams already work in, and on the quality of the risk models that decide which members get outreach first. Large vendors hold advantages in installed base, integration breadth, data scale and the ability to bundle care management with core clinical or payer systems. They also carry the compliance and security certifications that large payers and health systems require. Smaller and specialist suppliers compete on speed of deployment, focused workflows for a single condition or population, and flexible per-member pricing, and some win on service quality and local program design.
Presence matters unevenly by region. With 40% of 2025 revenue in North America and 25% in Europe, a supplier's coverage of those two decides most of its addressable base before any product question arises.
Per-company profiles, financials, share and development history are in the full report and not here.
List of Key Care Management Solutions Market Companies Profiled
28 companies profiled. Company profiles, including financials, product portfolios and recent developments, are part of the full report.
- Epic Systems Corporation(United States)
- Oracle Corporation (Oracle Health)(United States)
- Innovaccer Inc.(United States)
- Salesforce, Inc.(United States)
- Optum, Inc.(United States)
- Cotiviti, Inc.(United States)
- Health Catalyst, Inc.(United States)
- Arcadia.io, Inc.(United States)
- ZeOmega, Inc.(United States)
- Cedar Gate Technologies, Inc.(United States)
- HealthEC, LLC(United States)
- Azara Healthcare, LLC(United States)
- Medecision, Inc.(United States)
- Wellframe, Inc.(United States)
- Pega Systems Inc.(United States)
- Philips Healthcare (Koninklijke Philips N.V.)(Netherlands)
- Allscripts / Veradigm Inc.(United States)
- athenahealth, Inc.(United States)
- NextGen Healthcare, Inc.(United States)
- eClinicalWorks, LLC(United States)
- Evolent Health, Inc.(United States)
- Altruista Health, Inc.(United States)
- Casenet, LLC (Cotiviti)(United States)
- TCS Healthcare Technologies(United States)
- Welltok, Inc. (Virgin Pulse)(United States)
- Persivia, Inc.(United States)
- Lightbeam Health Solutions, Inc.(United States)
- MEDITECH (Medical Information Technology, Inc.)(United States)
Geographic Coverage
Every market below is broken out separately in the report.
North America
3Europe
8Asia Pacific
12Latin America
3Middle East and Africa
4Key Insights
Report Scope
Study parameters & segmentationThis study covers market size and forecasts over the 2020–2034 period, segmentation across 10 axes (Component, Care Management Type, Deployment Mode, End User, Functionality, Pricing Model, Care Setting, Patient Condition, Organization Size, Payment / Reimbursement Model), regional analysis for 5 regions and their constituent countries, a competitive landscape profiling 28 key companies, and the research methodology behind every estimate.
Segmentation
10 axes + regionQuestions This Report Answers
6 questionsWhat is the market size and growth rate, globally and by region?
How is the market segmented, and which segments lead?
Which regions and countries are covered, and how do they compare?
What are the key drivers, restraints, opportunities and challenges?
Who are the leading companies operating in this market?
What trends are expected to shape the market through the forecast period?
Frequently Asked Questions
01What is the Care Management Solutions Market projected to reach?
USD 46.5 USD Billion by 2034, CAGR 10%
02What years does this report cover?
Study period 2020–2034, base year 2025, historical data 2020-2024, forecast period 2026-2034.
03Which regions are covered?
North America, Europe, Asia Pacific, Latin America, Middle East and Africa.
04Which region accounted for the largest market share?
North America leads with 40% of global revenue through 2034.
05Which segment leads the market?
Software is the largest line by component, at 62% of revenue in 2025.
06Who are the key companies profiled?
Epic Systems Corporation, Oracle Corporation (Oracle Health), Innovaccer Inc., Salesforce, Inc., Optum, Inc., Cotiviti, Inc., Health Catalyst, Inc., Arcadia.io, Inc., ZeOmega, Inc., Cedar Gate Technologies, Inc., HealthEC, LLC, Azara Healthcare, LLC, Medecision, Inc., Wellframe, Inc., Pega Systems Inc., Philips Healthcare (Koninklijke Philips N.V.), Allscripts / Veradigm Inc., athenahealth, Inc., NextGen Healthcare, Inc., eClinicalWorks, LLC, Evolent Health, Inc., Altruista Health, Inc., Casenet, LLC (Cotiviti), TCS Healthcare Technologies, Welltok, Inc. (Virgin Pulse), Persivia, Inc., Lightbeam Health Solutions, Inc., MEDITECH (Medical Information Technology, Inc.). Full profiles are part of the paid report.
07Can the segmentation be customized?
Yes. Custom data cuts by geography, segment, or competitor set are available on request.
Why choose CDI
Need this report shaped around your question?
The scope isn't fixed. Tell us what your team needs that the standard edition doesn't cover, and an analyst will come back on what can be adjusted and how long it takes, before you commit to anything.
Most licences include 30–60 hours of customization at no extra cost. See what each licence includes
Additional Companies
Add competitors, suppliers or the peer set you benchmark against to the companies already covered.
Deeper Competitive View
Sharpen the landscape work around your own position: product line, channel, or a named shortlist of rivals.
Extra Segment Splits
Break the market down along an axis the standard scope doesn't cut it by, or go a level deeper inside one.
Application Focus
Narrow the analysis to the specific use cases and end users your team actually sells into.
Different Time Frame
Move the base year, or widen the historical and forecast windows the study is built on.
Country-Level Detail
Go below region level into the individual countries that matter to you, rather than the standard geography split.