
Autonomous Drone Systems MarketSize, Share & Industry Analysis, 2026-2034By Platform TypeBy Level of AutonomyBy ComponentBy RangeBy Size ClassBy ApplicationBy End UserBy Propulsion and Power SourceBy Payload CapacityBy Operation ModeBy Deployment ModelBy Sales Model
Full title & scope — all 12 axes with their segments
Autonomous Drone Systems Market Size, Share & Industry Analysis, By Platform Type (Multirotor, Fixed-Wing, Hybrid VTOL, Single-Rotor Helicopter, Loitering Munition/One-Way Attack, Tethered Systems), By Level of Autonomy (Remotely Piloted with Assisted Functions, Semi-Autonomous, Fully Autonomous, Swarm-Enabled Autonomous), By Component (Hardware, Sensors and Payloads, Software, Communication and Navigation Systems, Services), By Range (Short Range, Medium Range, Long Range, Beyond Visual Line of Sight Long Endurance), By Size Class (Nano and Micro, Small, Medium, Large), By Application (Intelligence, Surveillance and Reconnaissance, Inspection and Monitoring, Surveying and Mapping, Delivery and Logistics, Precision Agriculture, Combat and Strike, Search and Rescue and Emergency Response, Security and Perimeter Patrol), By End User (Defense and Military, Homeland Security and Public Safety, Commercial and Industrial, Agriculture and Forestry, Logistics and E-commerce, Energy and Utilities, Construction and Mining), By Propulsion and Power Source (Battery Electric, Hybrid Electric, Fuel Cell, Internal Combustion, Solar-Assisted), By Payload Capacity (Up to 2 kg, 2 to 25 kg, 25 to 150 kg, Above 150 kg), By Operation Mode (Visual Line of Sight, Extended Visual Line of Sight, Beyond Visual Line of Sight, GPS-Denied Operation), By Deployment Model (Drone-in-a-Box / Docked Systems, Portable / Manually Deployed, Vehicle-Launched, Ship-Launched), By Sales Model (Direct Sales / Government Procurement, Distributors and System Integrators, Online and E-commerce, Subscription and Drone-as-a-Service), and Regional Forecast, 2026-2034
Market outlook, key takeaways, drivers and challenges for the report period.
- 01By Platform TypeMultirotor · Fixed-Wing · Hybrid VTOL
- 02By Level of AutonomyRemotely Piloted with Assisted Functions · Semi-Autonomous · Fully Autonomous
- 03By ComponentHardware · Sensors and Payloads · Software
- 04By RangeShort Range · Medium Range · Long Range
- 05By Size ClassNano and Micro · Small · Medium
- 06By ApplicationIntelligence, Surveillance and Reconnaissance · Inspection and Monitoring · Surveying and Mapping
- 07By End UserDefense and Military · Homeland Security and Public Safety · Commercial and Industrial
- 08By Propulsion and Power SourceBattery Electric · Hybrid Electric · Fuel Cell
- 09By Payload CapacityUp to 2 kg · 2 to 25 kg · 25 to 150 kg
- 10By Operation ModeVisual Line of Sight · Extended Visual Line of Sight · Beyond Visual Line of Sight
- 11By Deployment ModelDrone-in-a-Box / Docked Systems · Portable / Manually Deployed · Vehicle-Launched
- 12By Sales ModelDirect Sales / Government Procurement · Distributors and System Integrators · Online and E-commerce
- 13By Region
Market Analysis & Outlook
Autonomous drone systems are unmanned aircraft that plan and fly missions, avoid obstacles and make routine decisions using onboard sensing and software, with a human supervising rather than steering. The category covers the airframe, flight controller, sensors and payloads, navigation and communication links, autonomy software and the services that keep fleets flying. Buyers include armed forces, border and public safety agencies, utilities and industrial operators, farms, and logistics and delivery networks.
USD 9.4 billion of revenue was recorded in the global autonomous drone systems market in 2025. By 2034 the figure reaches USD 32.73 billion, a compound annual growth rate of 15% through the forecast period, along a series that runs USD 3.9 billion in 2020, USD 7.88 billion in 2024, USD 10.7 billion in 2026 and USD 18.71 billion in 2030.
On the platform type axis, growth rates run from 11.1% for Multirotor up to 20.5% for Hybrid VTOL. Multirotor carries the volume: USD 4.33 billion and 46% of revenue in 2025, USD 11.13 billion and 34% in 2034. Fixed-Wing, Hybrid VTOL and Loitering Munition/One-Way Attack take share over the period; Multirotor, Single-Rotor Helicopter and Tethered Systems give it up while still growing in absolute terms.
Cut by level of autonomy, the largest line is Semi-Autonomous: 40% of 2025 revenue, worth USD 3.76 billion, and 33% at USD 10.8 billion by 2034. Swarm-Enabled Autonomous grows faster at 31.6% against 12.4%, moving from 5% of revenue to 17% by 2034. Both this axis and the platform type one divide the same revenue, which is why they are alternative views, not components.
The regional order runs from North America at 38% of 2025 revenue down to Latin America at 4%. North America is worth USD 3.57 billion in 2025 and USD 10.79 billion in 2034; Asia Pacific, second at 29%, moves from USD 2.73 billion to USD 11.13 billion. Share shifts toward Asia Pacific and Latin America over the forecast period, so the regional split repays a close reading.
The 2025 total is triangulated from published sources and category proxies, with no independently sourced count behind it. Segment, regional and country splits are estimated on the same basis, which bounds the precision of the figures above. Coverage runs to five regions, six platform type lines and twelve segmentation axes across a fifteen-year window.
Market Size, 2020–2034
USD BillionRevenue in USD Billion. Values up to 2025 are actuals; 2026–2034 are forecast.
Key Takeaways
- The global autonomous drone systems market moves from USD 3.9 billion in 2020 to USD 9.4 billion in 2025 and USD 32.73 billion by 2034, the forecast period compounding at 15% a year.
- 46% of 2025 revenue sits in Multirotor (USD 4.33 billion) and it remains the largest platform type line in 2034 at USD 11.13 billion and 34%.
- At 20.5%, Hybrid VTOL grows faster than any other platform type line, moving from USD 1.03 billion and 11% of revenue in 2025 to USD 5.56 billion and 17% in 2034.
- Scenario range for 2034 runs from USD 24.55 billion in the bear case to USD 40.91 billion in the bull case, against a base-case USD 32.73 billion, the spread a plan built on this forecast has to absorb.
- The largest region is North America, generating USD 3.57 billion in 2025 (38% of the global total) and USD 10.79 billion by 2034, ahead of Asia Pacific at 29%.
- Within North America, the United States is the worked country example, at USD 3.25 billion in 2025; 91% of regional revenue in the base year, and USD 9.85 billion by 2034.
- Fifteen years are reported, 2020 to 2034 with 2025 as the base: revenue, share and growth rate per line, per axis and per region, not as a single blended series.
Market Trends
Revenue Share, By Platform Type
Base year 2025Multirotor leads with 46.0% of platform type segment revenue.
Share of platform type segment revenue, most recent base year.
Three things move over 2026-2034, and they are worth separating: the platform type mix, the regional balance, and the 15% compounding underneath both.
Not one of them points downward. Growth is everywhere in absolute terms, and the interest is entirely in where it lands.
Hybrid VTOL outpaces Multirotor. 20.5% against 11.1%: that gap, between Hybrid VTOL and Multirotor, is the largest on the platform type axis. Hybrid VTOL takes its share of revenue from 11% to 17% while Multirotor gives up ground, from 46% to 34%. Neither contracts: USD 1.03 billion becomes USD 5.56 billion, USD 4.33 billion becomes USD 11.13 billion. What the spread decides is which of them a supplier's revenue is exposed to.
Asia Pacific and Latin America gain regional share. Asia Pacific moves from 29% of revenue in 2025 to 34% in 2034, worth USD 2.73 billion rising to USD 11.13 billion; Latin America moves from 4% of revenue in 2025 to 5% in 2034, worth USD 0.38 billion rising to USD 1.64 billion. The remaining regions grow in absolute terms while giving up share: North America at 38% moving to 33%, Europe at 21% moving to 20%, Middle East and Africa at 8% moving to 8%. The practical consequence is that regional weighting decides whether a participant matches the market rate or trails it, regardless of how its own revenue reads.
A continuation, not an inflection. Reading the series: USD 3.9 billion in 2020, USD 7.88 billion in 2024, USD 9.4 billion in 2025, USD 10.7 billion in 2026, USD 18.71 billion in 2030 and USD 32.73 billion in 2034. The forecast rate of 15% sits against 19.2% over the historical period, so the projection extends an observed trend instead of proposing a new one. That moves the planning question away from timing a turn and onto the platform type and regional mixes, where the actual movement is.
Market Growth Factors
The fastest line decides the blended rate
Market Drivers
3- 01The fastest line decides the blended rate
Hybrid VTOL compounds at 20.5% against 15% for the market, rising from USD 1.03 billion in 2025 to USD 5.56 billion in 2034 and from 11% of revenue to 17%. Set against 11.1% at the other end of the axis, this is the line that decides whether the market's 15% holds. Where a supplier sits on this axis therefore decides whether it grows with the market or below it.
- 02Regional weight, not regional count
The largest regional base is North America: USD 3.57 billion in 2025 at 38% of the global total, USD 10.79 billion by 2034, still 33%. Asia Pacific adds a further 29% at USD 2.73 billion, reaching USD 11.13 billion. Because both the existing revenue and the revenue added concentrate in these two, regional weighting matters more to a forecast than regional count does.
- 03The base has grown every year since 2020
USD 3.9 billion in 2020, USD 7.88 billion in 2024 and USD 9.4 billion in 2025: 19.2% compound growth before the forecast period even begins. From there the forecast carries 15% through to USD 32.73 billion in 2034. A forecast extending an observed trend is a different proposition from one proposing a turn, and that is why no ramp is applied: the 15% runs evenly across the period.
Growth drivers
| # | Growth driver | Impact | Gross contribution (USD Billion) | 2026-28 | 2029-31 | 2032-34 |
|---|---|---|---|---|---|---|
| 1 | Defence procurement of autonomous and attritable systems | High | +8.6 | High | High | Medium |
| 2 | AI-enabled autonomy and falling onboard compute cost | High | +6.2 | Medium | High | High |
| 3 | Beyond visual line of sight approvals and operating frameworks | Medium-High | +4.7 | High | High | Medium |
| 4 | Commercial adoption in inspection, logistics and agriculture | Medium | +3.9 | Medium | Medium | High |
| 5 | Lower sensor and battery costs and docked system uptake | Medium | +2.3 | Medium | Medium | Low |
| 6 | Others | Low | +1.3 | Low | Low | Low |
| Total | +27 | |||||
Restraints
| # | Restraint | Impact | Estimated reduction (USD Billion) | 2026-28 | 2029-31 | 2032-34 |
|---|---|---|---|---|---|---|
| 1 | Airspace regulation and certification delays | Medium-High | −1.7 | High | Medium | Low |
| 2 | Export controls and component supply constraints | Medium | −1.2 | Medium | Medium | Medium |
| 3 | Safety, cyber risk and public acceptance | Low | −0.77 | Low | Medium | Medium |
| Total | −3.67 | |||||
Drivers contribute 27 USD Billion and restraints remove 3.67 USD Billion, a net 23.33 USD Billion, which is the revenue the market adds between the base year and 2034. Contributions are CDI estimates, apportioned so that they reconcile with the forecast rather than being read from it.
The 15% forecast rate rests on three things that can be measured separately: the size of the existing base, the mix shift on the platform type axis, and where regional growth is concentrated.
Restraining Factors
The bear case and what drives it
Market Restraints
2- 01The bear case and what drives it
A bear case of USD 24.55 billion in 2034, against USD 32.73 billion in the base case, rests on one stated assumption: approval frameworks stay slow, export controls and supplier restrictions tighten component supply, and defence and commercial buyers delay fleet purchases, so autonomy adoption lags the base case. Neither case changes the USD 9.4 billion 2025 base.
- 02The largest line is not the fastest
Multirotor carries 46% of 2025 revenue at USD 4.33 billion but compounds at 11.1% against 15% for the market, taking its share to 34% by 2034 even as revenue rises to USD 11.13 billion. Because it carries that much of the base, its pace holds the blended rate down more than any faster line lifts it.
Market Opportunities
Upside case: USD 40.91 billion by 2034
Market Opportunities
2- 01Upside case: USD 40.91 billion by 2034
What would beat the forecast: beyond visual line of sight approvals spread faster, defence buyers fund attritable autonomous fleets at larger volumes, and compute and battery costs fall quickly enough to open new commercial uses ahead of plan. That case reaches USD 40.91 billion in 2034 against USD 32.73 billion, and it is worth testing against a reader's own read of the market.
- 02Hybrid VTOL is where share changes hands
Hybrid VTOL grows at 20.5% against 15% for the market, adding revenue from USD 1.03 billion in 2025 to USD 5.56 billion in 2034 and taking its share from 11% to 17%. It is the place on this axis where share changes hands at scale, so it is where an entrant can take position without displacing the incumbent in Multirotor.
Market Challenges
Concentration on the platform type axis
Market Challenges
2- 01Concentration on the platform type axis
USD 4.33 billion of 2025 revenue sits in Multirotor, 46% of the total, and it is still 34% at USD 11.13 billion nine years later. A market leaning this heavily on one platform type line concentrates its exposure there, and a shift in demand for that line moves the total more than any other single change on the axis.
- 02North America is largely the United States
North America is worth USD 3.57 billion in 2025 and USD 3.25 billion of that is the United States; 91% of the region, reaching USD 9.85 billion in 2034. Read as a region it looks diversified; read by weight it is not, and the regional forecast inherits whatever happens in that one market.
Segmentation Analysis
12 axestwelve segmentation axes are reported; by platform type, by level of autonomy, component, range, size class, application, end user, propulsion and power source, payload capacity, operation mode, deployment model and sales model. They are alternative readings of one revenue pool, not parts that sum to it.
There are six lines on the platform type axis, and all of them grow in revenue between 2025 and 2034. What separates them is share: three gain it, the rest give it up.
By Platform Type · 6 segments
Scale in Multirotor and Growth in Hybrid VTOL Define the Platform type Axis
- Largest Multirotor · 46%
- Fastest Hybrid VTOL · 20.5%
- Moves most Multirotor · -12 pts
- Order by 2034 changes
| Segment | 2025 | Share | 2034 | Share | CAGR |
|---|---|---|---|---|---|
| Multirotor | $4.33B | 46% | $11.13B | 34%-12 | 11.1% |
| Fixed-Wing | $1.69B | 18% | $6.22B | 19%+1 | 15.7% |
| Hybrid VTOL | $1.03B | 11% | $5.56B | 17%+6 | 20.5% |
| Single-Rotor Helicopter | $0.56B | 6% | $1.64B | 5%-1 | 12.7% |
| Loitering Munition/One-Way Attack | $1.32B | 14% | $6.87B | 21%+7 | 20.2% |
| Tethered Systems | $0.47B | 5% | $1.31B | 4%-1 | 12.2% |
Multirotor platforms lead because they are cheap, easy to launch and fit most inspection, mapping and security tasks. Loitering munitions grow fastest as armed forces buy large numbers of low-cost autonomous systems, and Hybrid VTOL gains from buyers who want runway-free launch with the endurance of a fixed wing. The order does not change: Multirotor is still largest in 2034, and what moves is how much it holds. Every year of the series is priced on this axis, making it the reference cut for the rest of the report.
By Level of Autonomy · 4 segments
Scale in Semi-Autonomous and Growth in Swarm-Enabled Autonomous Define the Level of autonomy Axis
- Largest Semi-Autonomous · 40%
- Fastest Swarm-Enabled Autonomous · 31.6%
- Moves most Remotely Piloted with Assisted Functions · -24 pts
- Order by 2034 changes
| Segment | 2025 | Share | 2034 | Share | CAGR |
|---|---|---|---|---|---|
| Remotely Piloted with Assisted Functions | $3.57B | 38% | $4.58B | 14%-24 | 2.8% |
| Semi-Autonomous | $3.76B | 40% | $10.80B | 33%-7 | 12.4% |
| Fully Autonomous | $1.60B | 17% | $11.79B | 36%+19 | 24.9% |
| Swarm-Enabled Autonomous | $0.47B | 5% | $5.56B | 17%+12 | 31.6% |
Semi-autonomous systems lead because they let operators keep control while automating routine flight, which satisfies most safety and procurement rules today. Swarm-enabled and fully autonomous systems grow fastest as onboard compute improves, regulators allow supervised operation without a pilot per aircraft, and defence buyers want fleets that keep working when links are jammed. By 2034 the largest line is Fully Autonomous and no longer Semi-Autonomous, the one axis here where the order actually changes.
By Component · 5 segments
Hardware Held the Dominant Share of the Component Segment in 2025
- Largest Hardware · 40%
- Fastest Software · 20.1%
- Moves most Hardware · -8 pts
- Order by 2034 changes
| Segment | 2025 | Share | 2034 | Share | CAGR |
|---|---|---|---|---|---|
| Hardware | $3.76B | 40% | $10.48B | 32%-8 | 12.1% |
| Sensors and Payloads | $2.26B | 24% | $7.20B | 22%-2 | 13.7% |
| Software | $1.32B | 14% | $6.87B | 21%+7 | 20.1% |
| Communication and Navigation Systems | $1.12B | 12% | $3.60B | 11%-1 | 13.9% |
| Services | $0.94B | 10% | $4.58B | 14%+4 | 19.2% |
Hardware leads because every airframe carries a flight controller, motors, batteries and structure that are bought up front. Software and services grow fastest as buyers move from one-off purchases to licensed autonomy stacks, fleet management, data processing and managed operations that bill every year. The order does not change: Hardware is still largest in 2034, and what moves is how much it holds.
By Range · 4 segments
Scale in Short Range and Growth in Beyond Visual Line of Sight Long Endurance Define the Range Axis
- Largest Short Range · 34%
- Fastest Beyond Visual Line of Sight Long Endurance · 22.3%
- Moves most Short Range · -12 pts
- Order by 2034 changes
| Segment | 2025 | Share | 2034 | Share | CAGR |
|---|---|---|---|---|---|
| Short Range | $3.20B | 34% | $7.20B | 22%-12 | 9.4% |
| Medium Range | $2.82B | 30% | $9.16B | 28%-2 | 14% |
| Long Range | $1.88B | 20% | $7.20B | 22%+2 | 16.1% |
| Beyond Visual Line of Sight Long Endurance | $1.50B | 16% | $9.17B | 28%+12 | 22.3% |
Short range leads because most current work, from inspection to site mapping, happens close to the operator. Long endurance beyond visual line of sight grows fastest as approvals for remote operation spread and buyers want one aircraft to cover pipelines, borders, farmland and logistics routes without a crew on site. By 2034 the largest line is Beyond Visual Line of Sight Long Endurance and no longer Short Range, the one axis here where the order actually changes.
By Size Class · 4 segments
Small Held the Dominant Share of the Size class Segment in 2025
- Largest Small · 41%
- Fastest Large · 21.8%
- Moves most Large · +9 pts
- Order by 2034 changes
| Segment | 2025 | Share | 2034 | Share | CAGR |
|---|---|---|---|---|---|
| Nano and Micro | $2.07B | 22% | $4.91B | 15%-7 | 10.1% |
| Small | $3.85B | 41% | $11.78B | 36%-5 | 13.2% |
| Medium | $2.26B | 24% | $8.84B | 27%+3 | 16.4% |
| Large | $1.22B | 13% | $7.20B | 22%+9 | 21.8% |
Small aircraft lead because they balance payload, price and ease of deployment for the widest set of buyers. Large platforms grow fastest as defence and logistics programmes shift toward heavier autonomous aircraft that carry bigger sensors, munitions or cargo and stay aloft longer. The order does not change: Small is still largest in 2034, and what moves is how much it holds.
By Application · 8 segments
By Application
- Largest Intelligence, Surveillance and Reconnaissance · 22%
- Fastest Delivery and Logistics · 26.3%
- Moves most Combat and Strike · +10 pts
- Order by 2034 changes
| Segment | 2025 | Share | 2034 | Share | CAGR |
|---|---|---|---|---|---|
| Intelligence, Surveillance and Reconnaissance | $2.07B | 22% | $5.56B | 17%-5 | 11.6% |
| Inspection and Monitoring | $1.59B | 17% | $4.58B | 14%-3 | 12.5% |
| Surveying and Mapping | $1.32B | 14% | $2.95B | 9%-5 | 9.3% |
| Delivery and Logistics | $0.56B | 6% | $4.58B | 14%+8 | 26.3% |
| Precision Agriculture | $0.85B | 9% | $2.62B | 8%-1 | 13.3% |
| Combat and Strike | $1.32B | 14% | $7.86B | 24%+10 | 21.9% |
| Search and Rescue and Emergency Response | $0.56B | 6% | $1.96B | 6% | 14.9% |
| Security and Perimeter Patrol | $1.13B | 12% | $2.62B | 8%-4 | 9.8% |
2025 to 2034 revenue and share by line: Intelligence, Surveillance and Reconnaissance USD 2.07 billion to USD 5.56 billion (22% to 17%), Inspection and Monitoring USD 1.59 billion to USD 4.58 billion (17% to 14%), Surveying and Mapping USD 1.32 billion to USD 2.95 billion (14% to 9%), Combat and Strike USD 1.32 billion to USD 7.86 billion (14% to 24%), Security and Perimeter Patrol USD 1.13 billion to USD 2.62 billion (12% to 8%), Precision Agriculture USD 0.85 billion to USD 2.62 billion (9% to 8%), Delivery and Logistics USD 0.56 billion to USD 4.58 billion (6% to 14%), Search and Rescue and Emergency Response USD 0.56 billion to USD 1.96 billion (6% to 6%). Intelligence, Surveillance and Reconnaissance Led by Application in 2025, with Delivery and Logistics Growing Fastest Intelligence, surveillance and reconnaissance leads because it is the longest-standing use of autonomous aircraft and has steady government funding. Delivery and logistics grows fastest from a small base as route approvals, docked hubs and retail partnerships turn pilot networks into routine service. By 2034 the largest line is Combat and Strike and no longer Intelligence, Surveillance and Reconnaissance, the one axis here where the order actually changes.
By End User · 7 segments
By End User
- Largest Defense and Military · 44%
- Fastest Logistics and E-commerce · 24.1%
- Moves most Logistics and E-commerce · +5 pts
- Order by 2034 changes
| Segment | 2025 | Share | 2034 | Share | CAGR |
|---|---|---|---|---|---|
| Defense and Military | $4.13B | 44% | $15.06B | 46%+2 | 15.5% |
| Homeland Security and Public Safety | $1.13B | 12% | $3.27B | 10%-2 | 12.5% |
| Commercial and Industrial | $1.88B | 20% | $5.24B | 16%-4 | 12.1% |
| Agriculture and Forestry | $0.75B | 8% | $2.29B | 7%-1 | 13.2% |
| Logistics and E-commerce | $0.47B | 5% | $3.27B | 10%+5 | 24.1% |
| Energy and Utilities | $0.66B | 7% | $2.29B | 7% | 14.8% |
| Construction and Mining | $0.38B | 4% | $1.31B | 4% | 14.7% |
2025 to 2034 revenue and share by line: Defense and Military USD 4.13 billion to USD 15.06 billion (44% to 46%), Commercial and Industrial USD 1.88 billion to USD 5.24 billion (20% to 16%), Homeland Security and Public Safety USD 1.13 billion to USD 3.27 billion (12% to 10%), Agriculture and Forestry USD 0.75 billion to USD 2.29 billion (8% to 7%), Energy and Utilities USD 0.66 billion to USD 2.29 billion (7% to 7%), Logistics and E-commerce USD 0.47 billion to USD 3.27 billion (5% to 10%), Construction and Mining USD 0.38 billion to USD 1.31 billion (4% to 4%). Scale in Defense and Military and Growth in Logistics and E-commerce Define the End user Axis Defence and military buyers lead because they fund the largest programmes and pay for the most capable autonomy. Logistics and e-commerce grows fastest as operators scale from trials to scheduled networks and as the economics of drone delivery improve against ground routes in dense or remote areas. The order does not change: Defense and Military is still largest in 2034, and what moves is how much it holds.
By Propulsion and Power Source · 5 segments
Battery Electric Held the Dominant Share of the Propulsion and power source Segment in 2025
- Largest Battery Electric · 78%
- Fastest Fuel Cell · 34.1%
- Moves most Battery Electric · -12 pts
- Order by 2034 changes
| Segment | 2025 | Share | 2034 | Share | CAGR |
|---|---|---|---|---|---|
| Battery Electric | $7.33B | 78% | $21.61B | 66%-12 | 12.8% |
| Hybrid Electric | $0.75B | 8% | $4.91B | 15%+7 | 23.2% |
| Fuel Cell | $0.14B | 1.5% | $1.96B | 6%+4.5 | 34.1% |
| Internal Combustion | $0.94B | 10% | $2.29B | 7%-3 | 10.4% |
| Solar-Assisted | $0.24B | 2.5% | $1.96B | 6%+3.5 | 26.3% |
Battery electric leads because it is quiet, low in cost, simple to maintain and suits the short missions most aircraft fly. Fuel cell grows fastest from a very small base as buyers seek longer endurance without combustion engines and as hydrogen supply and stack durability improve. The order does not change: Battery Electric is still largest in 2034, and what moves is how much it holds.
By Payload Capacity · 4 segments
Above 150 kg Outpaces the Axis While Up to 2 kg Holds the Largest Share
- Largest Up to 2 kg · 52%
- Fastest Above 150 kg · 26.6%
- Moves most Up to 2 kg · -16 pts
- Order by 2034 unchanged
| Segment | 2025 | Share | 2034 | Share | CAGR |
|---|---|---|---|---|---|
| Up to 2 kg | $4.89B | 52% | $11.78B | 36%-16 | 10.3% |
| 2 to 25 kg | $3.10B | 33% | $11.13B | 34%+1 | 15.3% |
| 25 to 150 kg | $0.94B | 10% | $5.89B | 18%+8 | 22.6% |
| Above 150 kg | $0.47B | 5% | $3.93B | 12%+7 | 26.6% |
The lightest class leads because most sensors and cameras weigh little and the aircraft that carry them are the cheapest to buy and fly. The heaviest class grows fastest as cargo, heavy sensor and munition programmes need autonomous aircraft that carry far more than the current fleet. By 2034 Up to 2 kg is still ahead, making this a shift in weight, not a change of leader.
By Operation Mode · 4 segments
Scale in Visual Line of Sight and Growth in GPS-Denied Operation Define the Operation mode Axis
- Largest Visual Line of Sight · 46%
- Fastest GPS-Denied Operation · 27.3%
- Moves most Visual Line of Sight · -26 pts
- Order by 2034 changes
| Segment | 2025 | Share | 2034 | Share | CAGR |
|---|---|---|---|---|---|
| Visual Line of Sight | $4.33B | 46% | $6.55B | 20%-26 | 4.7% |
| Extended Visual Line of Sight | $1.88B | 20% | $5.56B | 17%-3 | 12.8% |
| Beyond Visual Line of Sight | $2.63B | 28% | $15.71B | 48%+20 | 22% |
| GPS-Denied Operation | $0.56B | 6% | $4.91B | 15%+9 | 27.3% |
Visual line of sight leads because it is the mode most operators are already licensed to fly. Operation in GPS-denied conditions grows fastest as armed forces and infrastructure operators need aircraft that navigate by vision and inertial sensing where satellite signals are jammed, spoofed or unavailable. By 2034 the largest line is Beyond Visual Line of Sight and no longer Visual Line of Sight, the one axis here where the order actually changes.
By Deployment Model · 4 segments
Drone-in-a-Box / Docked Systems Outpaces the Axis While Portable / Manually Deployed Holds the Largest Share
- Largest Portable / Manually Deployed · 62%
- Fastest Drone-in-a-Box / Docked Systems · 28.6%
- Moves most Portable / Manually Deployed · -18 pts
- Order by 2034 changes
| Segment | 2025 | Share | 2034 | Share | CAGR |
|---|---|---|---|---|---|
| Drone-in-a-Box / Docked Systems | $0.75B | 8% | $7.20B | 22%+14 | 28.6% |
| Portable / Manually Deployed | $5.83B | 62% | $14.40B | 44%-18 | 10.6% |
| Vehicle-Launched | $1.69B | 18% | $6.55B | 20%+2 | 16.2% |
| Ship-Launched | $1.13B | 12% | $4.58B | 14%+2 | 16.8% |
Portable systems lead because they need no fixed site and suit the widest range of field crews. Drone-in-a-box and docked systems grow fastest as operators automate recurring inspection and security flights from a permanent base with no person on site to launch or recover the aircraft. The order does not change: Portable / Manually Deployed is still largest in 2034, and what moves is how much it holds.
By Sales Model · 4 segments
Direct Sales / Government Procurement Led by Sales model in 2025, with Subscription and Drone-as-a-Service Growing Fastest
- Largest Direct Sales / Government Procurement · 58%
- Fastest Subscription and Drone-as-a-Service · 29%
- Moves most Subscription and Drone-as-a-Service · +11 pts
- Order by 2034 changes
| Segment | 2025 | Share | 2034 | Share | CAGR |
|---|---|---|---|---|---|
| Direct Sales / Government Procurement | $5.46B | 58% | $17.02B | 52%-6 | 13.5% |
| Distributors and System Integrators | $2.44B | 26% | $7.20B | 22%-4 | 12.8% |
| Online and E-commerce | $0.94B | 10% | $2.95B | 9%-1 | 13.5% |
| Subscription and Drone-as-a-Service | $0.56B | 6% | $5.56B | 17%+11 | 29% |
Direct sales and government procurement lead because the largest autonomous systems are bought through contracts, qualification and long support agreements. Subscription and drone-as-a-service grows fastest as commercial users prefer to pay per mission or per fleet and avoid owning aircraft, training pilots and managing compliance. By 2034 Direct Sales / Government Procurement is still ahead, making this a shift in weight, not a change of leader.
Regional Insights
Regional Revenue Share
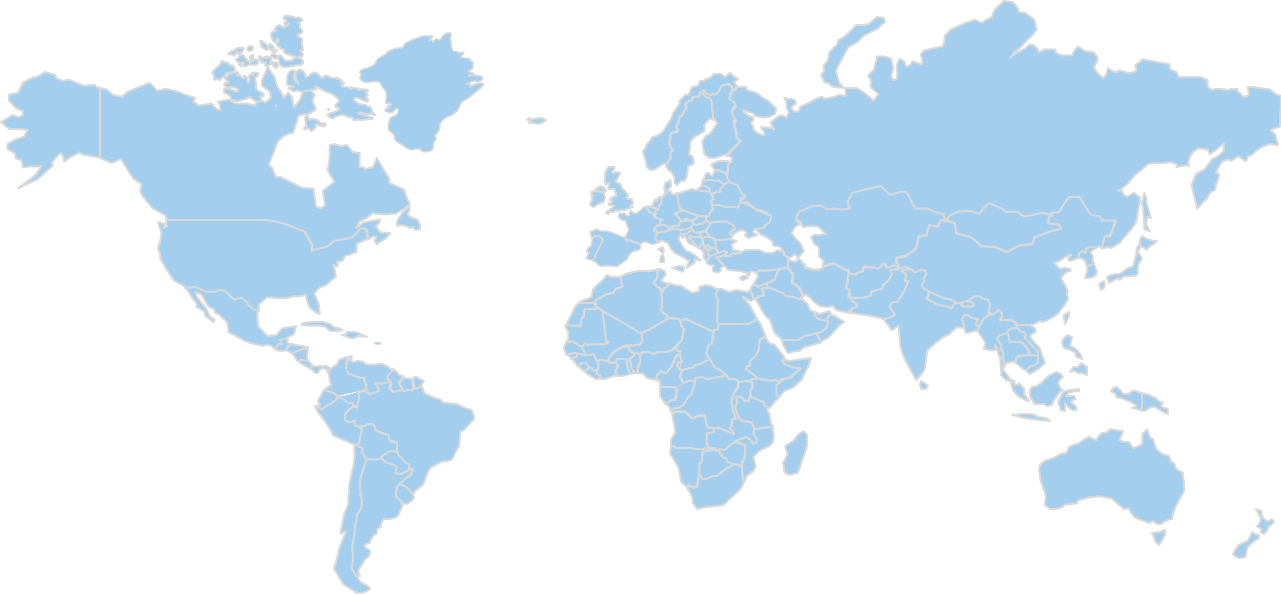
Base year 2025Share of global revenue in the base year.
Only the leading region's share is published outside the report; pins mark the region, not a specific country.
North America Market Analysis
The largest region covered, and the one giving up the most — 5 points of share move elsewhere by 2034, while revenue still grows 3.0×.
- Rank 1 of 5
- 2025 share 38%
- By 2034 33%
- Revenue $3.57B → $10.79B
USD 3.57 billion of 2025 revenue is generated in North America, 38% of the global autonomous drone systems market rising to USD 10.79 billion in 2034. It is a dominant region on this axis, first by revenue throughout the period.
Share settles at 33% in 2034, a shift in share, not in direction: revenue climbs every year while the market's centre of gravity moves elsewhere.
The platform type mix reported at global level applies here, with Multirotor the largest line at 46% of 2025 revenue and Hybrid VTOL the fastest-growing at 20.5%. North America is reported axis by axis and country by country in the full study.
United States
Sets the pace for North America at 91% of it, growing 3.0×.
- In region 1 of 2
- Of region 91%
- Of global 34.6%
- Revenue $3.25B → $9.85B
The largest single market in North America is the United States, at USD 3.25 billion in 2025 and USD 9.85 billion in 2034. 91% of the region in 2025 means the regional figures are, in practice, a view of this market with others attached. The region itself runs USD 3.57 billion to USD 10.79 billion over the same period, and this is the market carrying the country-level detail in the full report.
the United States buys along the same lines as the market globally; Multirotor first at 46% of 2025 revenue and 34% in 2034, Hybrid VTOL fastest at 20.5% on a share moving from 11% to 17%. Because the country carries 91% of North America, a movement in its own mix shows up in the regional totals instead of being averaged away by neighbouring markets. The United States carries its own platform type breakdown in the full report.
The Federal Aviation Administration governs unmanned aircraft in the United States. Small unmanned aircraft operations fall under the Small Unmanned Aircraft Systems rule, which sets remote pilot certification and operating limits. Flights beyond visual line of sight, over people or at night depend on waivers or specific operating approvals. Aircraft must be registered, and remote identification broadcast is required for most operations. Suppliers of autonomous systems must show that onboard software and detect-and-avoid functions support the declared operating category, and larger or more complex platforms may need type or airworthiness certification. The Federal Communications Commission separately authorises the radio equipment fitted to each aircraft.
The suppliers tracked in this study (Anduril Industries, Inc., Shield AI, Inc., Skydio, Inc., SZ DJI Technology Co., Ltd., AeroVironment, Inc., Teledyne FLIR LLC, General Atomics Aeronautical Systems, Inc., Northrop Grumman Corporation, Baykar Technology, Elbit Systems Ltd., Israel Aerospace Industries Ltd., Zipline International Inc., Wing Aviation LLC, Parrot SA, Percepto Robotics Ltd., Auterion AG, Quantum-Systems GmbH, EHang Holdings Limited, AgEagle Aerial Systems Inc., Red Cat Holdings, Inc., Lockheed Martin Corporation, Kratos Defense & Security Solutions, Inc., Textron Inc., Edge Autonomy, Autel Robotics Co., Ltd., XAG Co., Ltd., Flyability SA, Delair SAS, Helsing GmbH and Tekever Ltd.) compete in the United States across the platform type lines above. The commercially relevant division is 46% of 2025 revenue in Multirotor, where the volume is, against 20.5% growth in Hybrid VTOL, where share moves. The full report covers country-level positioning and shares company by company; this summary does not.
Canada
2nd-largest in North America, growing 3.2×.
- In region 2 of 2
- Of region 7%
- Of global 2.7%
- Revenue $0.25B → $0.80B
Within North America, Canada accounts for 7% of regional revenue and 2.7% of the global total, worth USD 0.25 billion in 2025 and USD 0.8 billion by 2034.
Europe Market Analysis
The 3rd-largest region covered — 1 point of share move elsewhere by 2034, while revenue still grows 3.3×.
- Rank 3 of 5
- 2025 share 21%
- By 2034 20%
- Revenue $1.97B → $6.55B
Europe holds 21% of the global autonomous drone systems market in 2025, worth USD 1.97 billion and reaches USD 6.55 billion by 2034. By revenue it sits third across the study, and the ranking does not change between 2025 and 2034.
20% of global revenue sits here in 2034, below the 2025 level, a shift in share, not in direction: revenue climbs every year while the market's centre of gravity moves elsewhere.
The platform type mix reported at global level applies here, with Multirotor the largest line at 46% of 2025 revenue and Hybrid VTOL the fastest-growing at 20.5%. Revenue for Europe is broken out by every segmentation axis and by country in the full report.
United Kingdom
The largest market in Europe, growing 3.1×.
- In region 1 of 3
- Of region 21.3%
- Of global 4.5%
- Revenue $0.42B → $1.30B
The United Kingdom is the largest market within Europe, generating USD 0.42 billion in 2025 and projected to reach USD 1.3 billion by 2034. At 21.3% of the region in 2025 it leads, but a majority of Europe's revenue is generated in other markets. Set against USD 1.97 billion and USD 6.55 billion for the region, it is why this market, and not a smaller one, is the one reported in full.
Composition here matches the global split: the largest line is Multirotor at 46% of 2025 revenue, easing to 34% by 2034, and the fastest is Hybrid VTOL at 20.5%, from 11% to 17%. With 21.3% of Europe concentrated here, a change in this country's mix is visible in the regional figures instead of being diluted by its neighbours. Revenue by platform type for the United Kingdom is reported separately in the full report.
The Civil Aviation Authority regulates unmanned aircraft in the United Kingdom under a risk-based framework that mirrors the European open, specific and certified categories. Low-risk operations fall in the open category, where products carry class markings and operators hold registration and competency proof. Autonomous or beyond visual line of sight flights usually sit in the specific category, which requires an operational authorisation backed by a risk assessment. Heavier or higher-risk platforms move toward certification. Suppliers must apply the UK Conformity Assessed mark and meet the relevant product standards, including radio equipment rules, and remote identification obligations apply to many aircraft.
In the United Kingdom the field is Anduril Industries, Inc., Shield AI, Inc., Skydio, Inc., SZ DJI Technology Co., Ltd., AeroVironment, Inc., Teledyne FLIR LLC, General Atomics Aeronautical Systems, Inc., Northrop Grumman Corporation, Baykar Technology, Elbit Systems Ltd., Israel Aerospace Industries Ltd., Zipline International Inc., Wing Aviation LLC, Parrot SA, Percepto Robotics Ltd., Auterion AG, Quantum-Systems GmbH, EHang Holdings Limited, AgEagle Aerial Systems Inc., Red Cat Holdings, Inc., Lockheed Martin Corporation, Kratos Defense & Security Solutions, Inc., Textron Inc., Edge Autonomy, Autel Robotics Co., Ltd., XAG Co., Ltd., Flyability SA, Delair SAS, Helsing GmbH and Tekever Ltd.. Volume sits in Multirotor at 46% of 2025 revenue; movement sits in Hybrid VTOL at 20.5% growth. The commercial size of that position is USD 1.97 billion in 2025, moving to USD 6.55 billion by 2034 across the forecast period.
Germany
2nd-largest in Europe, growing 3.2×.
- In region 2 of 3
- Of region 19.3%
- Of global 4%
- Revenue $0.38B → $1.20B
4% of global revenue is generated in Germany; USD 0.38 billion in 2025, reaching USD 1.2 billion in 2034, and 19.3% of Europe.
France
3rd-largest in Europe, growing 3.2×.
- In region 3 of 3
- Of region 15.2%
- Of global 3.2%
- Revenue $0.30B → $0.95B
3.2% of global revenue is generated in France; USD 0.3 billion in 2025, reaching USD 0.95 billion in 2034, and 15.2% of Europe.
Asia Pacific Market Analysis
The 2nd-largest region covered — it picks up 5 points of share by 2034, while revenue still grows 4.1×.
- Rank 2 of 5
- 2025 share 29%
- By 2034 34%
- Revenue $2.73B → $11.13B
In Asia Pacific, 29% of global revenue puts 2025 at USD 2.73 billion and reaches USD 11.13 billion by 2034. That makes it the second-largest region covered, in 2025 and again in 2034.
Its share rises to 34% over the forecast period, because it outgrows the market's 15%; the revenue added here is disproportionate to where the region started.
Segment composition follows the global pattern: Multirotor largest at 46% of 2025 revenue, Hybrid VTOL fastest at 20.5%. Revenue for Asia Pacific is broken out by every segmentation axis and by country in the full report.
China
The largest market in Asia Pacific, growing 3.4×.
- In region 1 of 3
- Of region 38.5%
- Of global 11.2%
- Revenue $1.05B → $3.60B
The largest single market in Asia Pacific is China, at USD 1.05 billion in 2025 and USD 3.6 billion in 2034. At 38.5% of the region in 2025 it leads, but a majority of Asia Pacific's revenue is generated in other markets. Against regional totals of USD 2.73 billion in 2025 and USD 11.13 billion in 2034, it is the country the full report breaks out in detail.
China buys along the same lines as the market globally; Multirotor first at 46% of 2025 revenue and 34% in 2034, Hybrid VTOL fastest at 20.5% on a share moving from 11% to 17%. Since 38.5% of Asia Pacific's revenue is generated here, the regional numbers inherit this market's mix instead of smoothing it out. The full report reports China by platform type separately.
The Civil Aviation Administration of China is the main regulator for unmanned aircraft, working alongside the Ministry of Industry and Information Technology on equipment and radio matters. Aircraft are classified by weight and risk, and heavier or higher-risk categories require operator licensing, real-name registration and airworthiness or type approval. Flight activity must follow airspace management rules, with approvals and real-time reporting through national traffic platforms for many operations. Suppliers must meet national standards for flight control, geofencing and identification, and radio transmission equipment needs separate type approval. Export of certain drone technologies is also subject to control by trade authorities.
Competition in China runs between the suppliers this study tracks: Anduril Industries, Inc., Shield AI, Inc., Skydio, Inc., SZ DJI Technology Co., Ltd., AeroVironment, Inc., Teledyne FLIR LLC, General Atomics Aeronautical Systems, Inc., Northrop Grumman Corporation, Baykar Technology, Elbit Systems Ltd., Israel Aerospace Industries Ltd., Zipline International Inc., Wing Aviation LLC, Parrot SA, Percepto Robotics Ltd., Auterion AG, Quantum-Systems GmbH, EHang Holdings Limited, AgEagle Aerial Systems Inc., Red Cat Holdings, Inc., Lockheed Martin Corporation, Kratos Defense & Security Solutions, Inc., Textron Inc., Edge Autonomy, Autel Robotics Co., Ltd., XAG Co., Ltd., Flyability SA, Delair SAS, Helsing GmbH and Tekever Ltd.. Multirotor, at 46% of 2025 revenue, is where the volume sits, and Hybrid VTOL, growing at 20.5%, is where position changes hands over the forecast period. The commercial size of that position is USD 2.73 billion in 2025 and USD 11.13 billion by 2034, 29% of the global total in the base year.
Japan
2nd-largest in Asia Pacific, growing 3.2×.
- In region 2 of 3
- Of region 11%
- Of global 3.2%
- Revenue $0.30B → $0.95B
3.2% of global revenue is generated in Japan; USD 0.3 billion in 2025, reaching USD 0.95 billion in 2034, and 11% of Asia Pacific.
India
3rd-largest in Asia Pacific, growing 5.9×.
- In region 3 of 3
- Of region 8.1%
- Of global 2.3%
- Revenue $0.22B → $1.30B
2.3% of global revenue is generated in India; USD 0.22 billion in 2025, reaching USD 1.3 billion in 2034, and 8.1% of Asia Pacific.
Latin America Market Analysis
The 5th-largest region covered — it picks up 1 point of share by 2034, while revenue still grows 4.3×.
- Rank 5 of 5
- 2025 share 4%
- By 2034 5%
- Revenue $0.38B → $1.64B
In Latin America, 4% of global revenue puts 2025 at USD 0.38 billion with USD 1.64 billion projected for 2034. It is a marginal region on this axis, fifth by revenue throughout the period.
Share climbs to 5% by 2034, on growth above the market's own 15%, and with a bigger contribution to the revenue added over the period than the base-year figure suggests.
The platform type mix reported at global level applies here, with Multirotor the largest line at 46% of 2025 revenue and Hybrid VTOL the fastest-growing at 20.5%. The full report breaks Latin America out along every axis and by country.
Brazil
The largest market in Latin America, growing 4.4×.
- In region 1 of 2
- Of region 42.1%
- Of global 1.7%
- Revenue $0.16B → $0.70B
USD 0.16 billion of Latin America's 2025 revenue is generated in Brazil, the region's largest market, reaching USD 0.7 billion by 2034. At 42.1% of the region in 2025 it leads, but a majority of Latin America's revenue is generated in other markets. The region itself runs USD 0.38 billion to USD 1.64 billion over the same period, and this is the market carrying the country-level detail in the full report.
Demand in Brazil follows the platform type mix reported at global level: Multirotor is the largest line at 46% of 2025 revenue, moving to 34% by 2034, while Hybrid VTOL grows fastest at 20.5% and takes its share from 11% to 17%. Because the country carries 42.1% of Latin America, a movement in its own mix shows up in the regional totals instead of being averaged away by neighbouring markets. Per-platform type revenue for Brazil appears on its own in the full report.
The National Civil Aviation Agency, known as ANAC, sets the rules for unmanned aircraft in Brazil through its special requirements for remotely piloted aircraft, while the Department of Airspace Control manages access to airspace and the National Telecommunications Agency, Anatel, certifies radio equipment. Aircraft are grouped by takeoff weight and operating risk. Larger platforms and those flying beyond visual line of sight require registration, aircraft and pilot qualification, and operational approval, often with insurance. Suppliers must obtain Anatel homologation for the communication links before an autonomous system can be sold or operated legally.
Competition in Brazil runs between the suppliers this study tracks: Anduril Industries, Inc., Shield AI, Inc., Skydio, Inc., SZ DJI Technology Co., Ltd., AeroVironment, Inc., Teledyne FLIR LLC, General Atomics Aeronautical Systems, Inc., Northrop Grumman Corporation, Baykar Technology, Elbit Systems Ltd., Israel Aerospace Industries Ltd., Zipline International Inc., Wing Aviation LLC, Parrot SA, Percepto Robotics Ltd., Auterion AG, Quantum-Systems GmbH, EHang Holdings Limited, AgEagle Aerial Systems Inc., Red Cat Holdings, Inc., Lockheed Martin Corporation, Kratos Defense & Security Solutions, Inc., Textron Inc., Edge Autonomy, Autel Robotics Co., Ltd., XAG Co., Ltd., Flyability SA, Delair SAS, Helsing GmbH and Tekever Ltd.. The commercially relevant division is 46% of 2025 revenue in Multirotor, where the volume is, against 20.5% growth in Hybrid VTOL, where share moves. A supplier weighted toward Latin America is competing over a base of USD 0.38 billion in 2025, reaching USD 1.64 billion by 2034 on the trajectory this study models.
Mexico
2nd-largest in Latin America, growing 4.4×.
- In region 2 of 2
- Of region 23.7%
- Of global 1%
- Revenue $0.09B → $0.40B
Mexico is sized at USD 0.09 billion in 2025, rising to USD 0.4 billion by 2034; 1% of global revenue and 23.7% of Latin America. It is reported separately from Brazil across every segmentation axis in the full report.
Middle East and Africa Market Analysis
The 4th-largest region covered, holding its share flat through 2034, while revenue still grows 3.5×.
- Rank 4 of 5
- 2025 share 8%
- By 2034 8%
- Revenue $0.75B → $2.62B
In Middle East and Africa, 8% of global revenue puts 2025 at USD 0.75 billion and reaches USD 2.62 billion by 2034. By revenue it sits fourth across the study, and the ranking does not change between 2025 and 2034.
Its share moves to 8% by 2034, a shift in share, not in direction: revenue climbs every year while the market's centre of gravity moves elsewhere.
The platform type mix reported at global level applies here, with Multirotor the largest line at 46% of 2025 revenue and Hybrid VTOL the fastest-growing at 20.5%. Per-axis and per-country detail for Middle East and Africa sits in the full report.
Israel
The largest market in Middle East and Africa, growing 3.2×.
- In region 1 of 3
- Of region 29.3%
- Of global 2.3%
- Revenue $0.22B → $0.70B
29.3% of Middle East and Africa's base-year revenue comes from Israel; USD 0.22 billion, rising to USD 0.7 billion by 2034. It accounts for 29.3% of regional revenue in the base year, the largest single share without dominating the region outright. Against regional totals of USD 0.75 billion in 2025 and USD 2.62 billion in 2034, it is the country the full report breaks out in detail.
Composition here matches the global split: the largest line is Multirotor at 46% of 2025 revenue, easing to 34% by 2034, and the fastest is Hybrid VTOL at 20.5%, from 11% to 17%. Since 29.3% of Middle East and Africa's revenue is generated here, the regional numbers inherit this market's mix instead of smoothing it out. Revenue by platform type for Israel is reported separately in the full report.
The Civil Aviation Authority of Israel regulates unmanned aircraft and sets requirements for operator registration, pilot training and operating permits. Operations are divided by risk, with routine low-altitude flights under general conditions and more complex activity, such as flights beyond visual line of sight or over populated areas, needing specific permission and a safety case. The Ministry of Communications governs radio frequency use and equipment approval. Defence-related and dual-use autonomous platforms also fall under export and security controls administered by the Ministry of Defense. Suppliers must document system reliability and safe-failure behaviour to gain approval for autonomous flight.
The suppliers tracked in this study (Anduril Industries, Inc., Shield AI, Inc., Skydio, Inc., SZ DJI Technology Co., Ltd., AeroVironment, Inc., Teledyne FLIR LLC, General Atomics Aeronautical Systems, Inc., Northrop Grumman Corporation, Baykar Technology, Elbit Systems Ltd., Israel Aerospace Industries Ltd., Zipline International Inc., Wing Aviation LLC, Parrot SA, Percepto Robotics Ltd., Auterion AG, Quantum-Systems GmbH, EHang Holdings Limited, AgEagle Aerial Systems Inc., Red Cat Holdings, Inc., Lockheed Martin Corporation, Kratos Defense & Security Solutions, Inc., Textron Inc., Edge Autonomy, Autel Robotics Co., Ltd., XAG Co., Ltd., Flyability SA, Delair SAS, Helsing GmbH and Tekever Ltd.) compete in Israel across the platform type lines above. Multirotor, at 46% of 2025 revenue, is where the volume sits, and Hybrid VTOL, growing at 20.5%, is where position changes hands over the forecast period. A supplier weighted toward Middle East and Africa is competing over a base of USD 0.75 billion in 2025 reaching USD 2.62 billion by 2034, 8% of global revenue at the start of that period.
United Arab Emirates
2nd-largest in Middle East and Africa, growing 3.9×.
- In region 2 of 3
- Of region 18.7%
- Of global 1.5%
- Revenue $0.14B → $0.55B
Within Middle East and Africa, the United Arab Emirates accounts for 18.7% of regional revenue and 1.5% of the global total, worth USD 0.14 billion in 2025 and USD 0.55 billion by 2034.
Saudi Arabia
3rd-largest in Middle East and Africa, growing 4.6×.
- In region 3 of 3
- Of region 17.3%
- Of global 1.4%
- Revenue $0.13B → $0.60B
Saudi Arabia is sized at USD 0.13 billion in 2025, rising to USD 0.6 billion by 2034; 1.4% of global revenue and 17.3% of Middle East and Africa. It is reported separately from Israel across every segmentation axis in the full report.
Download a free sample to see the full data tables and segment-level detail behind this analysis.
Report Coverage
This report assesses the market across every segment, with revenue and a growth rate for each line in each year of the study period. It covers the drivers, trends, opportunities, restraints and challenges shaping growth, the competitive landscape and the companies profiled, and the research methodology behind every estimate. Segmentation is reported by Platform Type, Level of Autonomy, Component, Range, Size Class, Application, End User, Propulsion and Power Source, Payload Capacity, Operation Mode, Deployment Model, Sales Model, and regional analysis covers North America, Europe, Asia Pacific, Latin America, Middle East and Africa, each broken out by country.
Competitive Landscape
Position on the Platform type Axis Decides Competitive Standing
The study covers the following suppliers: Anduril Industries, Inc., Shield AI, Inc., Skydio, Inc., SZ DJI Technology Co., Ltd., AeroVironment, Inc., Teledyne FLIR LLC, General Atomics Aeronautical Systems, Inc., Northrop Grumman Corporation, Baykar Technology, Elbit Systems Ltd., Israel Aerospace Industries Ltd., Zipline International Inc., Wing Aviation LLC, Parrot SA, Percepto Robotics Ltd., Auterion AG, Quantum-Systems GmbH, EHang Holdings Limited, AgEagle Aerial Systems Inc., Red Cat Holdings, Inc., Lockheed Martin Corporation, Kratos Defense & Security Solutions, Inc., Textron Inc., Edge Autonomy, Autel Robotics Co., Ltd., XAG Co., Ltd., Flyability SA, Delair SAS, Helsing GmbH and Tekever Ltd..
The competitive line that matters is the platform type one, not the geographic one. Volume sits in Multirotor, USD 4.33 billion and 46% of 2025 revenue, 34% by 2034, which is also where an incumbent is hardest to dislodge. Movement is concentrated in Hybrid VTOL; 20.5% growth, against 11.1% at the other end of the axis in Multirotor. A supplier positioned in one is not automatically positioned in the other, so a field of this size stays viable in a market of USD 9.4 billion.
Suppliers separate on the depth of their autonomy software, the ability to qualify aircraft with defence and aviation authorities, and the capacity to build in volume at a stable cost. The largest players hold government relationships, certification experience, integrated sensor and communication stacks and the scale to absorb long procurement cycles. Smaller and regional firms compete on specialised payloads, faster iteration, local support, niche applications such as agriculture or inspection, and lower prices. Supply reliability for batteries, compute modules and imaging sensors, and exposure to export controls, increasingly decide who wins larger contracts.
The regional picture sets the entry cost: 38% of revenue is in North America and 29% in Asia Pacific, so a credible global position requires both, while Latin America at 4% can be served opportunistically.
The full report carries a profile, financials, share and development history for each company named; none of that is in this summary.
List of Key Autonomous Drone Systems Market Companies Profiled
30 companies profiled. Company profiles, including financials, product portfolios and recent developments, are part of the full report.
- Anduril Industries, Inc.(United States)
- Shield AI, Inc.(United States)
- Skydio, Inc.(United States)
- SZ DJI Technology Co., Ltd.(China)
- AeroVironment, Inc.(United States)
- Teledyne FLIR LLC(United States)
- General Atomics Aeronautical Systems, Inc.(United States)
- Northrop Grumman Corporation(United States)
- Baykar Technology(Turkey)
- Elbit Systems Ltd.(Israel)
- Israel Aerospace Industries Ltd.(Israel)
- Zipline International Inc.(United States)
- Wing Aviation LLC(United States)
- Parrot SA(France)
- Percepto Robotics Ltd.(Israel)
- Auterion AG(Switzerland)
- Quantum-Systems GmbH(Germany)
- EHang Holdings Limited(China)
- AgEagle Aerial Systems Inc.(United States)
- Red Cat Holdings, Inc.(United States)
- Lockheed Martin Corporation(United States)
- Kratos Defense & Security Solutions, Inc.(United States)
- Textron Inc.(United States)
- Edge Autonomy(United States)
- Autel Robotics Co., Ltd.(China)
- XAG Co., Ltd.(China)
- Flyability SA(Switzerland)
- Delair SAS(France)
- Helsing GmbH(Germany)
- Tekever Ltd.(Portugal)
Geographic Coverage
Every market below is broken out separately in the report.
North America
3Europe
8Asia Pacific
12Latin America
3Middle East and Africa
4Key Insights
Report Scope
Study parameters & segmentationThis study covers market size and forecasts over the 2020–2034 period, segmentation across 12 axes (Platform Type, Level of Autonomy, Component, Range, Size Class, Application, End User, Propulsion and Power Source, Payload Capacity, Operation Mode, Deployment Model, Sales Model), regional analysis for 5 regions and their constituent countries, a competitive landscape profiling 30 key companies, and the research methodology behind every estimate.
Segmentation
12 axes + regionQuestions This Report Answers
6 questionsWhat is the market size and growth rate, globally and by region?
How is the market segmented, and which segments lead?
Which regions and countries are covered, and how do they compare?
What are the key drivers, restraints, opportunities and challenges?
Who are the leading companies operating in this market?
What trends are expected to shape the market through the forecast period?
Frequently Asked Questions
01What is the Autonomous Drone Systems Market projected to reach?
USD 32.73 USD Billion by 2034, CAGR 15%
02What years does this report cover?
Study period 2020–2034, base year 2025, historical data 2020-2024, forecast period 2026-2034.
03Which regions are covered?
North America, Europe, Asia Pacific, Latin America, Middle East and Africa.
04Which region accounted for the largest market share?
North America leads with 38% of global revenue through 2034.
05Which segment leads the market?
Multirotor is the largest line by Platform Type, at 46% of revenue in 2025.
06Who are the key companies profiled?
Anduril Industries, Inc., Shield AI, Inc., Skydio, Inc., SZ DJI Technology Co., Ltd., AeroVironment, Inc., Teledyne FLIR LLC, General Atomics Aeronautical Systems, Inc., Northrop Grumman Corporation, Baykar Technology, Elbit Systems Ltd., Israel Aerospace Industries Ltd., Zipline International Inc., Wing Aviation LLC, Parrot SA, Percepto Robotics Ltd., Auterion AG, Quantum-Systems GmbH, EHang Holdings Limited, AgEagle Aerial Systems Inc., Red Cat Holdings, Inc., Lockheed Martin Corporation, Kratos Defense & Security Solutions, Inc., Textron Inc., Edge Autonomy, Autel Robotics Co., Ltd., XAG Co., Ltd., Flyability SA, Delair SAS, Helsing GmbH, Tekever Ltd.. Full profiles are part of the paid report.
07Can the segmentation be customized?
Yes. Custom data cuts by geography, segment, or competitor set are available on request.
Why choose CDI
Need this report shaped around your question?
The scope isn't fixed. Tell us what your team needs that the standard edition doesn't cover, and an analyst will come back on what can be adjusted and how long it takes, before you commit to anything.
Most licences include 30–60 hours of customization at no extra cost. See what each licence includes
Additional Companies
Add competitors, suppliers or the peer set you benchmark against to the companies already covered.
Deeper Competitive View
Sharpen the landscape work around your own position: product line, channel, or a named shortlist of rivals.
Extra Segment Splits
Break the market down along an axis the standard scope doesn't cut it by, or go a level deeper inside one.
Application Focus
Narrow the analysis to the specific use cases and end users your team actually sells into.
Different Time Frame
Move the base year, or widen the historical and forecast windows the study is built on.
Country-Level Detail
Go below region level into the individual countries that matter to you, rather than the standard geography split.